Figure 6.
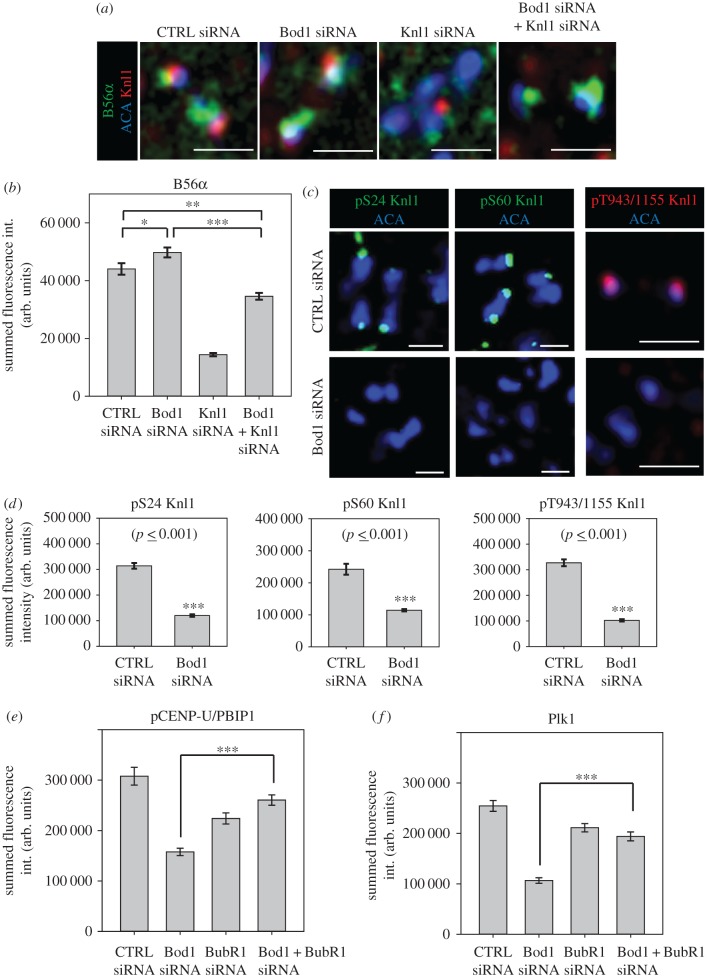
Bod1 controls Knl1 phosphorylation and antagonizes BubR1-dependent phosphatase activity at the kinetochore. (a) HeLa cells were treated with the indicated siRNAs for 48 h, fixed in paraformaldehyde and stained with a PP2A-B56α isoform-specific antibody (green) as well as a Knl1 antibody (red), and ACA (blue) as a centromeric marker. (b) Quantification of B56α kinetochore staining in the experiment shown in (a). Asterisks indicate degree of significance in multiple comparison after ANOVA on ranks: *p-value < 0.05, **p-value < 0.01, ***p-value < 0.001. (c) HeLa cells were treated with the indicated siRNAs for 48 h, fixed in paraformaldehyde and stained with different phospho-specific antibodies raised against three types of phosphorylatable motifs in Knl1: the SILK motif (S24), the RVSF motif (S60), and the MELT motifs (T943 and T1155). (d) Quantification of indicated Knl1 phosphosites in control and Bod1-depleted cells. Pairwise comparisons were evaluated by unpaired Student's t-test. Two-tailed p-values are shown. n = 10 cells per condition. Error bars represent standard error. Quantification of (e) phospho-CENP-U/PBIP1 and (f) Plk1 kinase staining at mitotic kinetochores of cells treated with the indicated siRNAs for 48 h. Three asterisks indicate high significance (p < 0.001) in multiple comparison after ANOVA on ranks. n = 10 cells per mitotic phase. Error bars represent standard error. All images shown are single z-sections. Scale bars are 1 µm.

