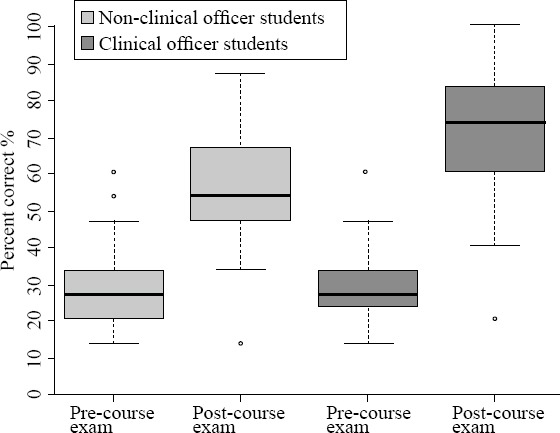
Figure 4.

Clinical officer students vs. non-clinical health students in 2016. Non-clinical health student and clinical officer student pre-course and post-course exam scores are plotted on the X-axis, respectively. Percent correct is shown on the Y-axis. Both non-clinical officer students and clinical officer students scored significantly higher on the post-course exam than the pre-course exam (P<0.01). In addition, the clinical officer students had significantly higher post-course exam scores than non-clinical officer students (P<0.01). Outliers are shown.
