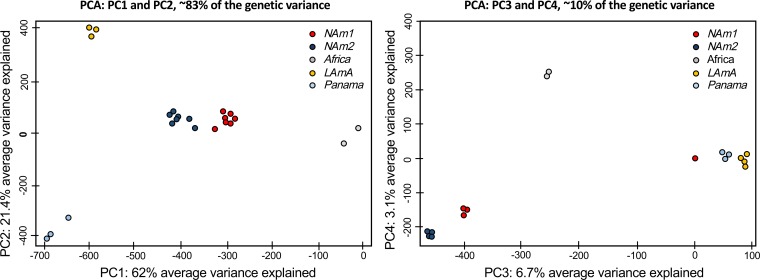
FIG 1 .
Principal-component analysis for Histoplasma using whole-genome allelic frequencies. The genetic variance in the genus Histoplasma indicates the existence of discrete genetic clusters. Red, NAm 1; blue, NAm 2; yellow, LAm A; gray, Africa; light blue, Panama. (Left panel) Principal components (PC) 1 and 2 are shown, and the percentage of variance explained by each eigenvalue is shown within parentheses on each axis. (Right panel) PC3 and PC4.

