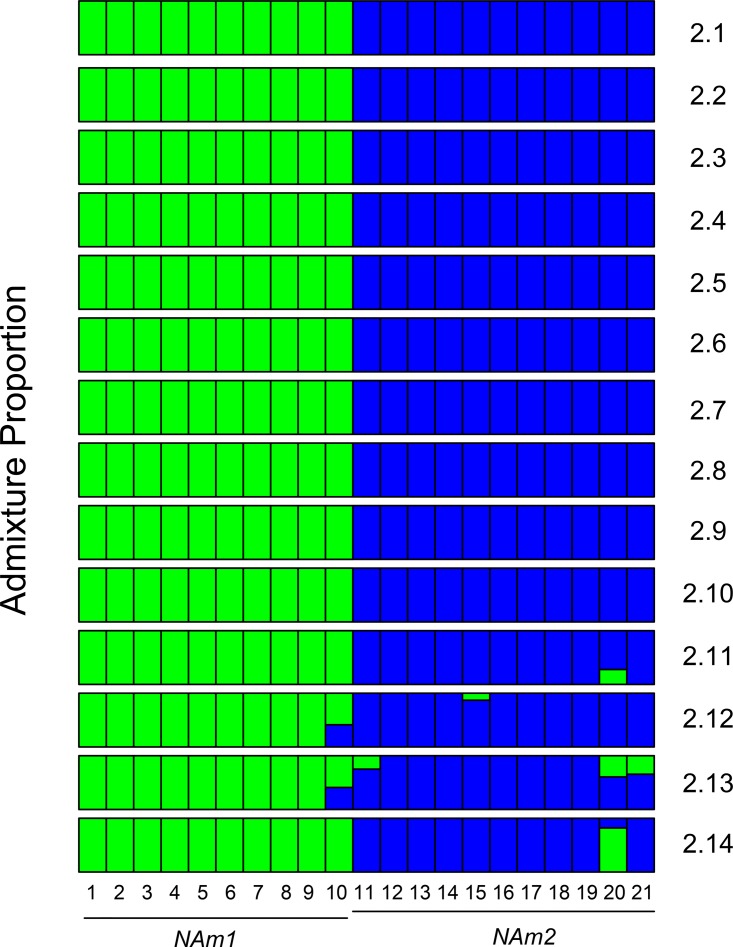
FIG 6 .
ADMIXTURE results for NAm 1 and NAm 2. ADMIXTURE proportions among NAm 1 and NAm 2 isolates (K = 2). Each of the two clusters is represented by a different color, and each isolate is represented by a vertical line divided into two colored segments with heights proportional to genotype memberships in the clusters. Thin black lines separate isolates. 1: 505; 2, CI_19; 3, CI_22; 4, CI_24; 5, CI_42; 6, CI_43; 7, CI_7; 8, Downs; 9, UCLA_531; 10, WU24; 11, 1986; 12, CI_10; 13, CI_17; 14, CI_18; 15, CI_30; 16, CI_35; 17, CI_4; 18, CI_6; 19, CI_9; 20, G217B; 21, G222B. We ran independent analyses for the largest 14 supercontigs, indicated by the number on the right. Results from the whole-genome analyses are concordant with the results from supercontigs 2.1 to 2.10.

