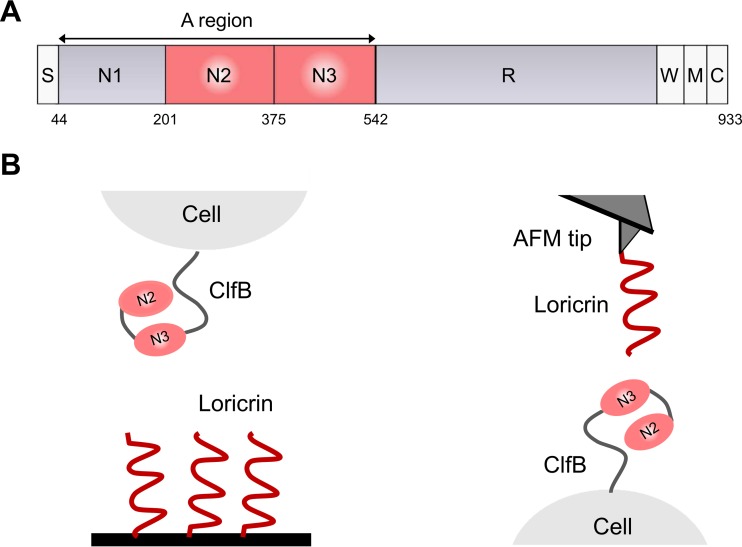
FIG 1 .
Force spectroscopy of the ClfB-Lor interaction. (A) Schematic diagram of the domain organization of ClfB showing the ligand-binding A region made of the N1, N2, and N3 subdomains; the serine-aspartate repeat region (R); the wall-spanning domain (W); the membrane anchor (M); and the cytoplasmic positively charged tail (C). (B) Analysis of the ClfB-Lor interaction by SCFS (left) and SMFS (right). For clarity, the N1 subdomain of ClfB is not shown (see the text for details).

