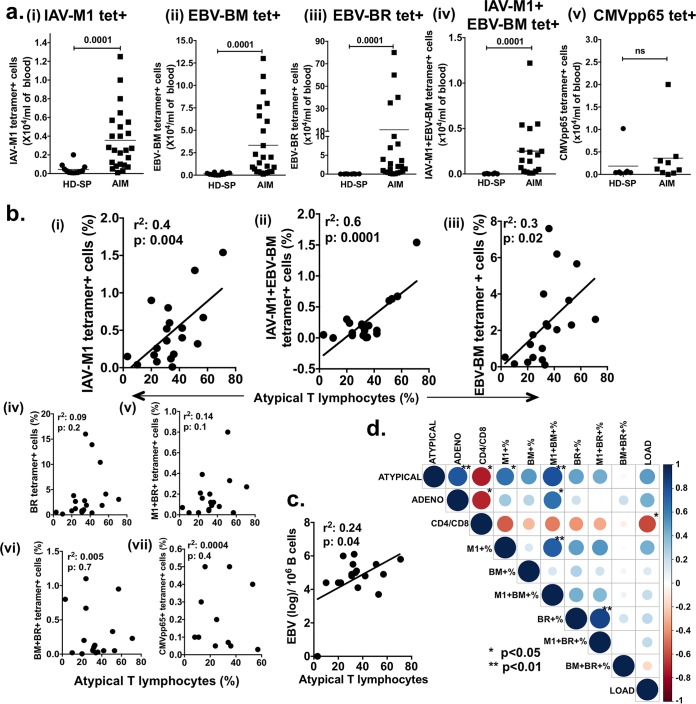
FIG 2 .
Only total IAV-M1 and IAV-M1+EBV-BM tetramer+ CD8 T cell levels in PBMCs analyzed ex vivo strongly correlate with AIM severity and predict the increased relative risk of severe AIM. (a) The average numbers of tetramer+ IAV-M1 (M1) (i), EBV-BM (BM) (ii) EBV-BR (BR) (iii) and IAV-M1+EBV-BM (M1+ BM+) (n = 23 to 25) (iv), but not CMV pp65-specific (n = 7 to 9) (v), CD8 T cells/ml of peripheral blood were significantly higher in AIM patients at the peak of their CD8 response than in healthy persistently infected EBV-seropositive donors (HD-SP) (n = 8 to 12) (Mann-Whitney U test). ns, not significant. (b) During the course of AIM, the peak (highest) frequency of tetramer+ IAV-M1 (i), IAV-M1+EBV-BM (ii), and EBV-BM (iii) CD8 T cells ex vivo directly correlated with the percentage of atypical lymphocytes; the peak frequency of tetramer+ EBV-BR (iv), IAV-M1+EBV-BR (v), EBV-BM+EBV-BR (vi), and CMV pp65 (vii) CD8 T cells ex vivo did not correlate with the percentage of atypical lymphocytes (n = 17 to 19 AIM patients per analysis). (c) During the course of EBV infection, the peak (greatest) viral load (measured as the genome copy number per B cell) had a weak direct correlation with disease severity measured as the percentage of atypical lymphocytes. (d) Display of pairwise correlations between variables of interest computed in a correlation matrix by using the Pearson correlation coefficient (the P values shown are adjusted for the number of multiple variant comparisons) and then graphically displayed as a matrix by using the corrplot R package with dark blue as the most positive correlation coefficient of 1 and dark red an inverse correlation coefficient of −1. Relative-risk analyses are shown in Table S2.

