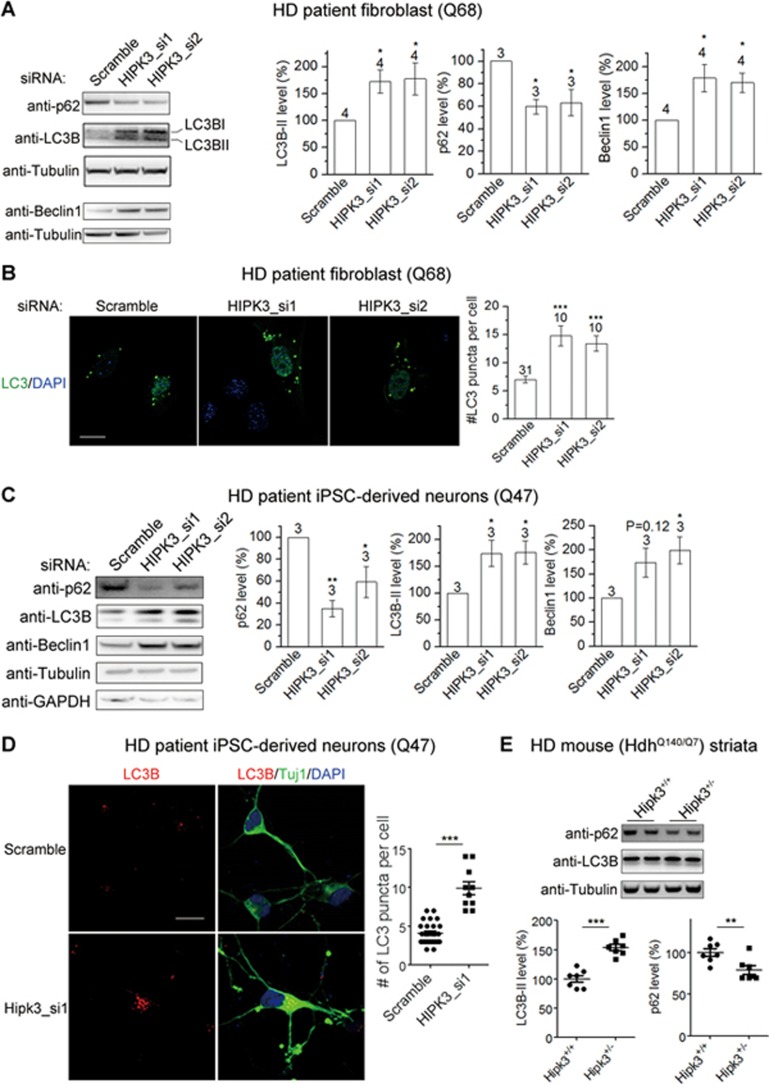
Figure 6.
Hipk3 regulates autophagy flux. (A) Representative western blots and quantification of human patient fibroblasts (Q68) transfected with HIPK3 siRNAs versus scrambled control siRNA. LC3B-II and Beclin1 levels were increased whereas the p62 levels were decreased. The statistical analysis was performed by one-way ANOVA and Dunnett's post hoc tests. *P < 0.05. (B) Representative images and quantification of microscopy experiments showing that the number of GFP-LC3 puncta was increased by knocking down HIPK3 in patient fibroblasts (Q68) cells transfected with the GFP-LC3 plasmid. Scale bar, 20 μm. The statistical analysis was performed by one-way ANOVA and Dunnett's post hoc tests. ***P < 0.001. (C) Similar to (A) but from patient iPSC-derived neurons (Q47). The statistical analysis was performed by one-way ANOVA and Dunnett's post hoc tests. *P < 0.05; **P < 0.01. (D) Representative images and quantification of endogenous LC3II puncta in patient iPSC-derived neurons (Q47) by immunostaining with the LC3II antibody. Over-expression of LC3 led to toxicity in these cells and changed their morphology, and thus endogenous LC3II puncta were examined. Scale bar, 20 μm. The statistical analysis was performed by two-way unpaired t tests. ***P < 0.001. (E) Representative western blots and quantification of mouse striata tissue lysate samples. The genotypes have been indicated. Each point represents a single mouse. Note that the samples were from the same mice used in Figure 2D. For all bar plots, data represent mean and SEM, and the numbers indicate biological replicates for western blots, or the number of cells in imaging analysis. Images were analyzed blindly by ImageJ.

