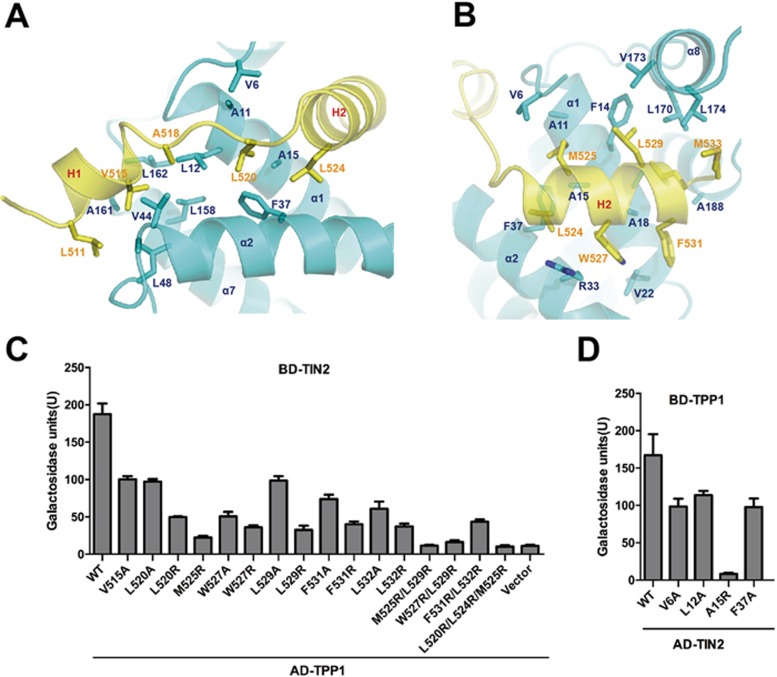
Figure 3.
The interface between TIN2TRFH and TPP1TBM. (A) Details of hydrophobic interactions around H1 and L12 of TPP1. The interaction residues are presented as ball-and-stick models. TPP1 residues are colored in yellow and TIN2 residues are colored in cyan. (B) Details of hydrophobic contacts between H2 of TPP1 and TIN2. (C, D) Effects of mutations in the TPP1TBM (C) and TIN2TRFH (D) domains on the interaction between TIN2 and TPP1 analyzed in a yeast two-hybrid assay. Data are the average of three independent β-galactosidase measurements.

