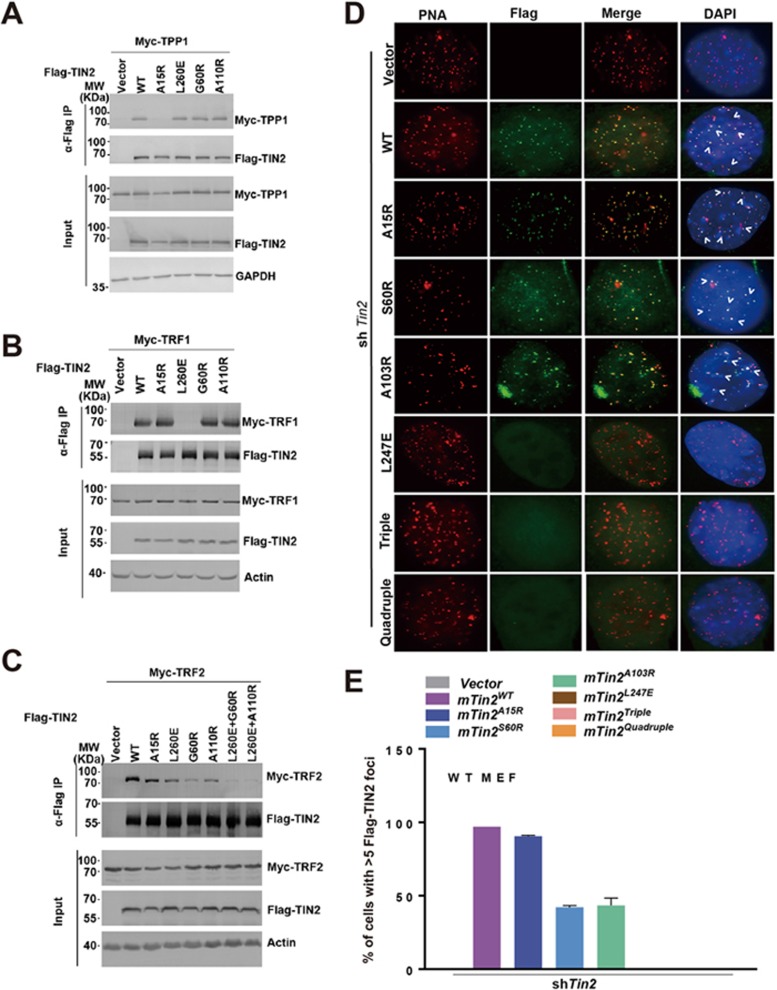
Figure 5.
Analysis of TIN2 interaction with binding partners in vivo. (A-C) 293T cells expressing the indicated protein were immunoprecipitated with Flag antibody and immunoblotted with Flag and Myc antibodies. The input represents 5% of the total cell lysate used for immunoprecipitation. GADPH or actin was used as loading control. (D) WT MEFs were reconstituted with WT or indicated mTIN2 mutants before Tin2 shRNA was used to deplete endogenous TIN2. Telomeres were visualized with telomere PNA-FISH (red), anti-Flag antibody to visualize mTIN2 (green), and DAPI staining to visualize nuclei (blue). (E) Quantification of the percent of cells with ≥5 foci of WT Flag mTIN2 and the mutants on telomeres in (D). Data are the mean of two independent experiments ± SEM; more than 100 nuclei were examined per experiment.

