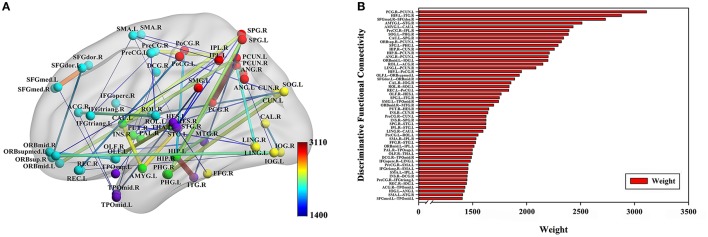
Figure 3.
Fifty-one discriminative functional connectivity are selected by feature selection. (A) The distribution of 51 discriminative functional connectivity in the brain. (B) All discriminative functional connectivity weight graphs. The color of the node in (A) represents the module to which the node belongs. Blue represents frontal, yellow represents occipital, red represents parietal, green represents subcortical and purple represents temporal. The color and thickness of the connectivity represent the weight of the connectivity. The weight refers to the weight value assigned to each feature in the Relief feature selection method.

