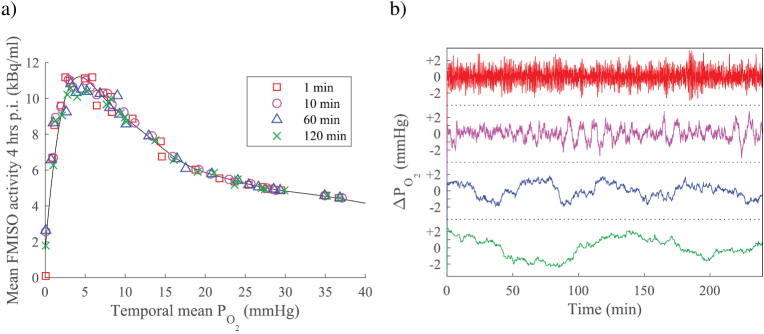
Figure 5.
(a) Volume-averaged temporal mean oxygen tension and FMISO activity 4 h p.i for simulations in tissue with dynamic vasculature. Each symbol type represents simulations with a different average period of perfusion fluctuations (in the range 1 min–120 min), and average instantaneous perfused vessel fraction of 50%. Black line is a smoothing spline to guide the eye, fit to all data points. (b) Example time structures for variation in tissue mean , around a value of 10 mmHg. Average period of fluctuations denoted by the same colour and position as in the legend of (a) i.e. top trace represents a period of 1 min, bottom trace represents 120 min.

