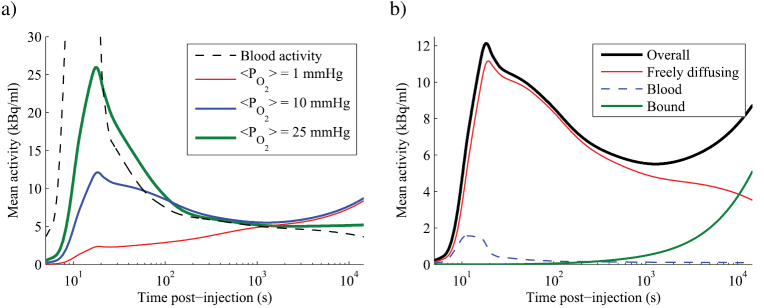
Figure 6.
(a) Simulated time-activity curves for tissue with perfused fraction of 50% and three different vascular maps, leading to a range of temporal mean values. Plotted activity is a spatial average over the whole simulation domain, and is attenuation corrected to time of injection. Logarithmic time axis spans 4 h. Peak value of blood activity curve is 63.4 kBq ml−1 and occurs at 11 s. (b) Relative contributions of activity in each compartment of the model to the overall time-activity curve labelled mmHg in (a). Animations showing the spatial distribution of FMISO in each compartment over time are available in the supplementary material.

