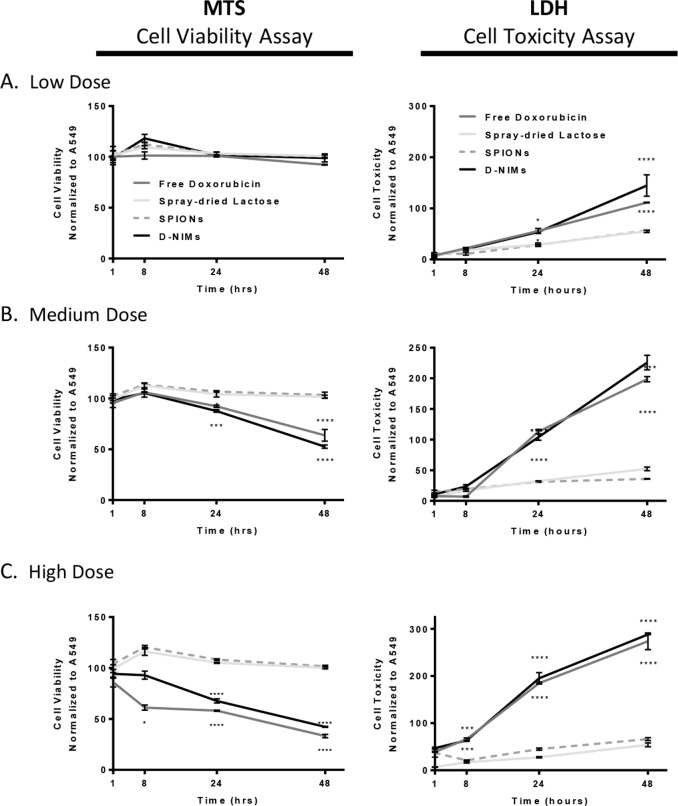
Figure 2.
MTS viability and LDH cytotoxicity assay of A549 cells exposed to doxorubicin-loaded NIMs. MTS (left panel) and LDH (right panel) assay measuring viability and cytotoxicity, respectively, of A549 lung adenocarcinoma cells after 48 h of exposure to (A) low dose of D-NIMs compared to free doxorubicin (1 μg NIMs containing 0.016 μg doxorubicin compared to 0.03 μg free doxorubicin), (B) medium dose of D-NIMs compared to free doxorubicin (10 μg NIMs containing 0.16 μg doxorubicin compared to 0.3 μg free doxorubicin), and (C) high dose of D-NIMs compared to free doxorubicin (100 μg NIMs containing 1.6 μg doxorubicin compared to 3.0 μg free doxorubicin). Free doxorubicin control (dark gray), spray-dried lactose control (light gray), SPIONs control (dashed gray), D-NIMs (black); for both MTS and LDH panels. Lactose and SPIONs controls were used at the ratios from the spray-dried feed solution and were held constant relative to doxorubicin. A two-way ANOVA with Sidak’s multiple comparison test was used to determine statistical significance. *p <.05; **p <.01, ***p <.001, ****p <.0001; data shown with standard error of the mean (SEM) and n = 3.

