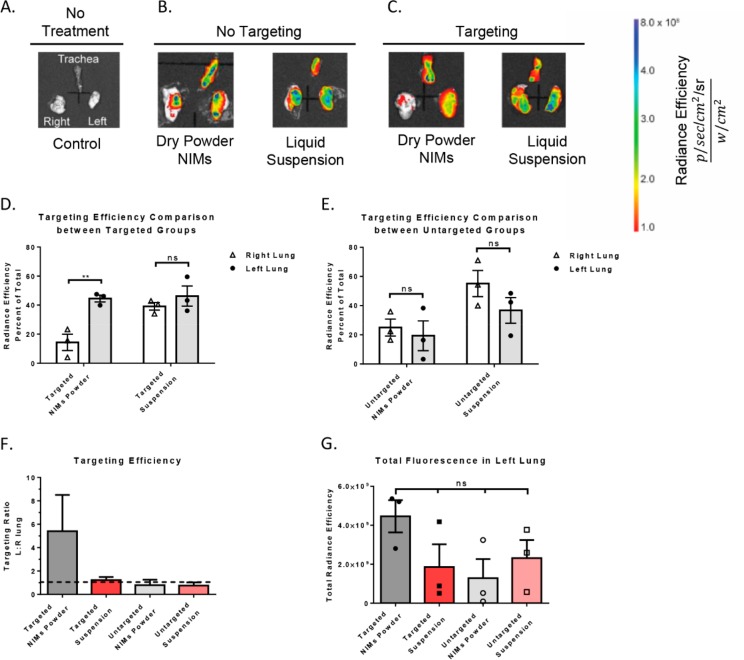
Figure 3.
Fluorescence quantification in murine lungs after magnetic-field-dependent targeting. (A) Untreated control, no fluorescence is observed in lungs or trachea (n = 1). The trachea (upper half of image), the right lung (left side of image), and the left lung (right side of image) are shown. (B) No targeting controls: NIMs dry powder and liquid suspension in the absence of magnetic targeting (n = 3; representative images shown). (C) Targeted treatment groups: NIMs dry powder and liquid suspension in the presence of magnetic targeting (n = 3; representative images shown). (D,E) Comparison of targeting efficiency (measured as radiance efficiency, graphed as percent of total) of NIMs dry powder and liquid suspension in left (targeted) and right lungs (untargeted) in the (D) presence and (E) absence of magnetic targeting. (F) Targeting efficiency ratio between the left (targeted) and the right (untargeted) lung in the presence and absence of magnetic-field-dependent targeting. The dashed line represents equal fluorescence in the left and right lung. Any fluorescence above the dashed line shows targeting to magnetized left lung. (G) Fluorescence (in total radiance efficiency) quantified in the left targeted lung after delivery of NIMs dry powder and liquid suspension (in the presence and absence of magnetic targeting). A two-way ANOVA with Sidak’s multiple comparison test (for D and E) or a one-way ANOVA with Tukey’s multiple comparison post-test (for G) was used to determine statistical significance. *p <.05; **p <.01; ns = not significant; data shown with standard error of the mean (SEM) and n = 3.

