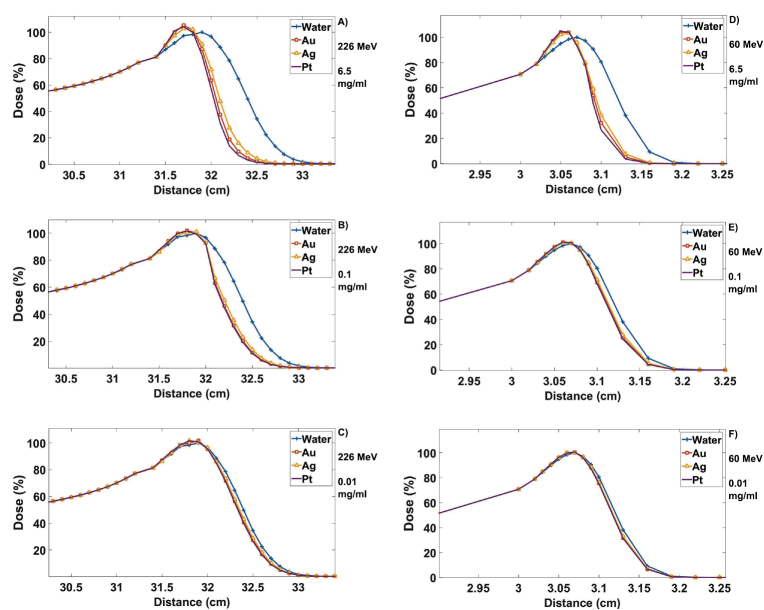
Figure 3.
Plots shown of simulated nano-film results, with nano-film regions beginning at depths of 31.31 and 3.02 cm for 226 and 60 MeV, respectively. All materials normalised to the peak water dose, demonstrating the level of enhancement and changes to the BP at 226 MeV for concentrations of (a) 6.5 mg ml−1 (b) 0.1 mg ml−1 and (c) 0.01 mg ml−1 and 60 MeV for (d) 6.5 mg ml−1 (e) 0.1 mg ml−1 and (f) 0.01 mg ml−1.

