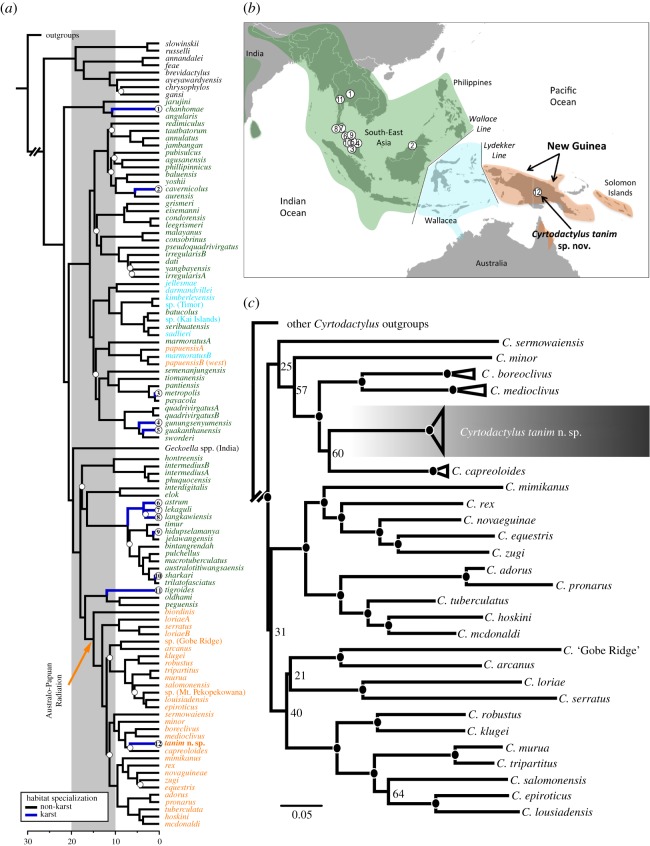
Figure 1.
(a) Time-calibrated, multi-locus cladogram generated in BEAST reconstructing relationships within Cyrtodactylus. Tip names are coloured by area of occupation corresponding to the map in panel (b) (Asian—green, Wallacean—blue and Melanesian—orange). Branches coloured royal blue correspond to sampled karst taxa (with numbers in circles corresponding to localities in b). Posterior probability support values below a standard cut-off (PP < 0.90) are indicated with a white dot subtending the poorly supported node. (c) Maximum-likelihood RAxML phylogeny for the main Australo-Papuan Cyrtodactylus lineages estimated using approximately 900 bp of the mitochondrial ND2 gene. Maximum-likelihood bootstrap support values (≥70%) are indicated by black circles subtending each node; when the value is below this threshold, it is given.

