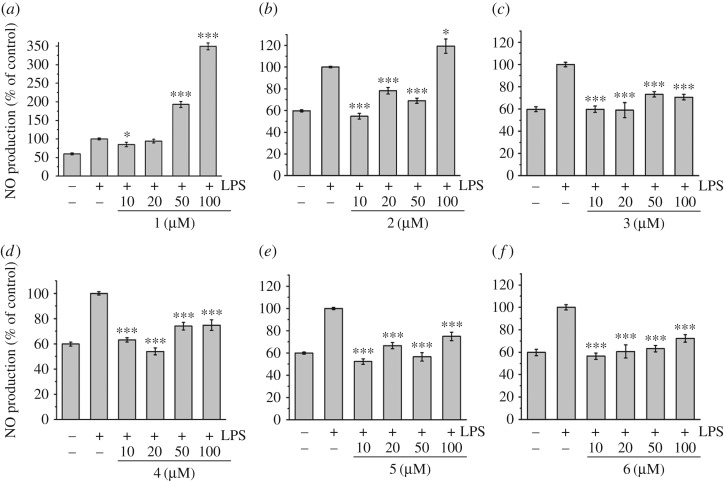
Figure 5.
Effects of complexes 1–6 on NO production in LPS-induced MRC-5 fibroblast cells. NO production was measured by the Griess reaction assay and expressed as a percentage of the control (LPS alone ‘+ −’). The negative control ‘− −’ looks at the NO production for cells untreated with LPS or any complex. Values are the mean + s.d. of at least three independent experiments. Detailed data were included in the electronic supplementary material. All statistical analyses refer to the positive control (LPS alone ‘+ −’). *p < 0.05, **p < 0.01, ***p < 0.001.

