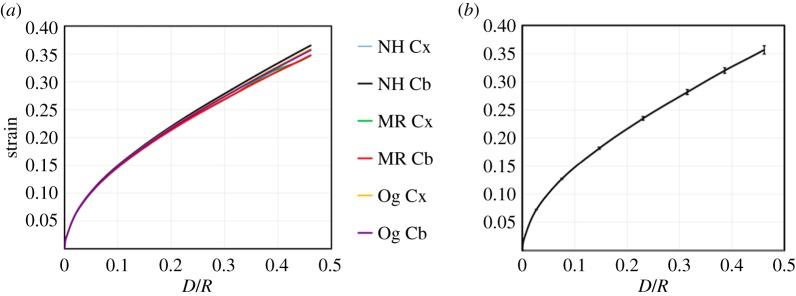
Figure 6.
(a) Maximum axial logarithmic strain versus D/R plots showing the invariance of the axial logarithmic strain in finite element simulations of using experimentally derived material properties for brain tissue and the neo-Hookean (NH), Mooney–Rivlin (MR) and Ogden (Og) models for both the cortex (Cx) and cerebellum (Cb). (b) The mean ± standard deviation force–displacement curve.

