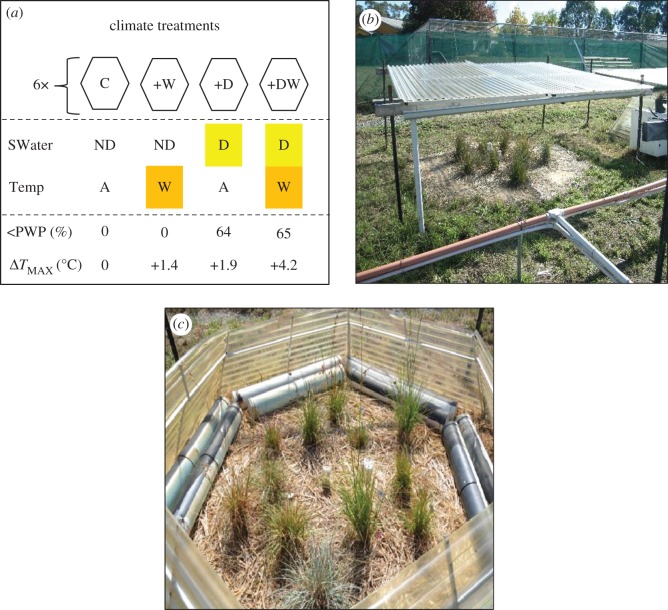
Figure 2.
Design of field experiment and climate treatments. (a) Plots received both a soil water treatment (SWater), either ND = non-drought or D = drought, and a temperature treatment (Temp), either A = ambient or W = warming, resulting in four climate treatments: C = ambient temperature + non-drought (‘control’), +D = ambient temperature + drought (‘drought’), +W = atmospheric warming + non-drought (‘warm’), and +DW = atmospheric warming + drought (‘warm drought’). Observed soil water and temperature conditions during the experiment are shown: <PWP(%) = the percentage of time with soil water below the permanent wilting point between 1 November 2014 and 10 April 2015 and ΔTMAX(°C) = change in mean daily maximum temperature in +W, +D and +DW treatments relative to the C treatment. Climate treatments were randomly allocated to plots (n = 4) arranged in complete blocks (n = 6). (b) Polycarbonate rainout shelter used to exclude rainfall and generate drought. (c) Polycarbonate hexagon open-top chamber containing water-filled PVC pipes used to generate diurnal and nocturnal atmospheric warming.

