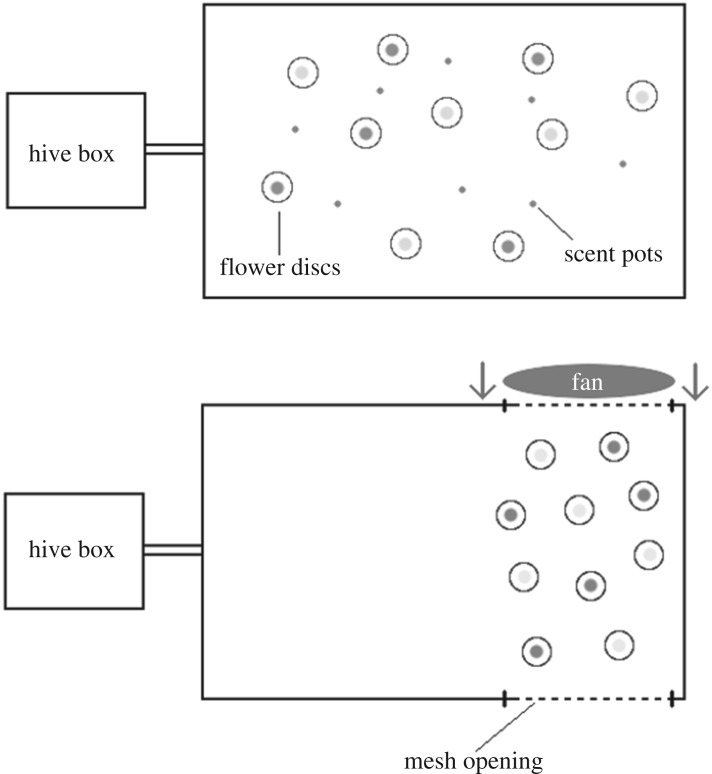
Figure 2.
Diagram showing the experimental setup of the two experiments within this study. The first setup displays a typical distribution of artificial flowers and scent pots during the chemical interference experiment, whereas the second setup displays a typical distribution of artificial flowers used during the wind simulation experiment. No comparisons are made between the results of the two experiment types.

