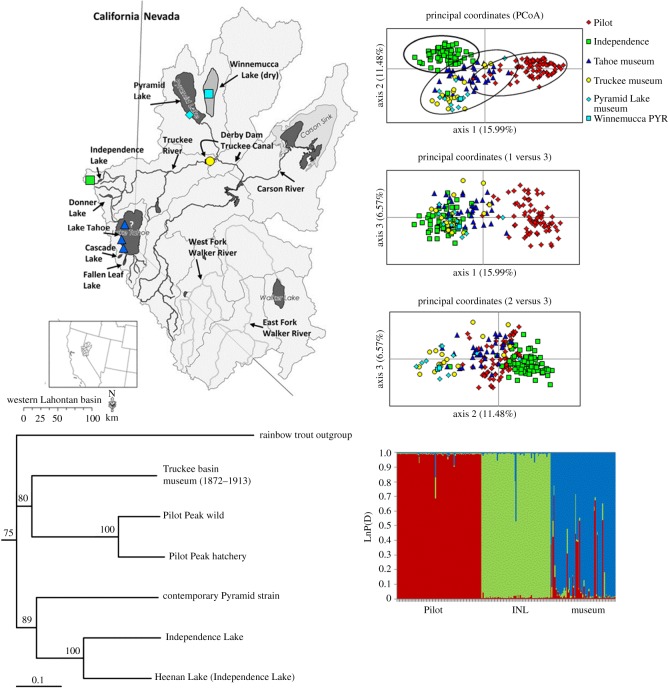
Figure 6.
The results of Bayesian genotype clustering analysis, PCoA, and a Cavalli-Sforza genetic distance and neighbour-joining phylogenic analysis of the Truckee River historical museum samples, extant Pilot Peak and Independence Lake populations. Three genotype clusters are the best fit of the data, showing the Pilot and museum sharing membership in the red cluster and a little overlap with the Independence Lake cluster (green) (LnP(D) = −3513.3, k = 3, Δk= 596.8). Sampling locations are colour coded in the map to correspond with PCoA and Bayesian plots.

