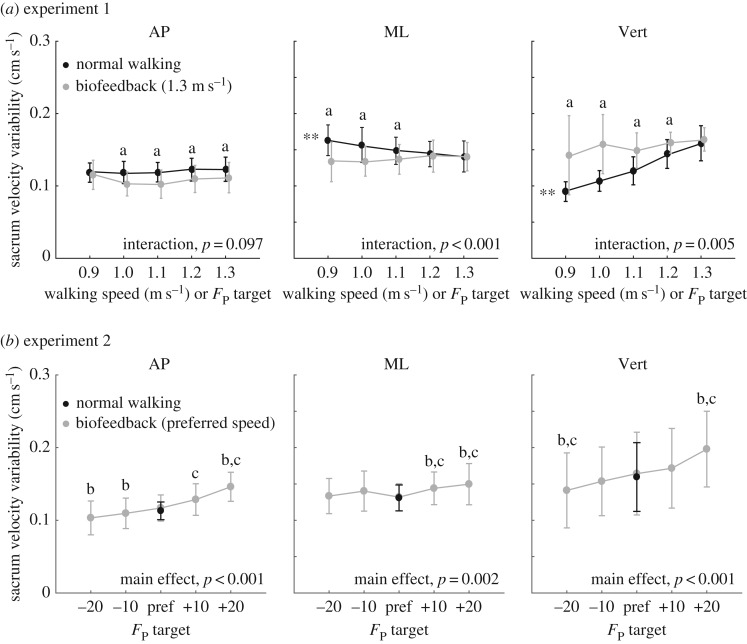
Figure 4.
Group mean (standard deviation) anterior–posterior (AP), mediolateral (ML) and vertical (Vert) sacrum velocity variability for (a) systematic changes in walking speed and propulsive force targets extracted from slower speeds, and (b) walking at preferred speed with propulsive forces smaller or larger than preferred. Double asterisks represent significant (p < 0.05) main effects of speed or propulsive force. ‘a’ Significant (p < 0.05) pairwise difference at matched propulsive forces, ‘b’ significantly (p < 0.05) different from normal walking with biofeedback and ‘c’ significantly (p < 0.05) different from normal walking without biofeedback.

