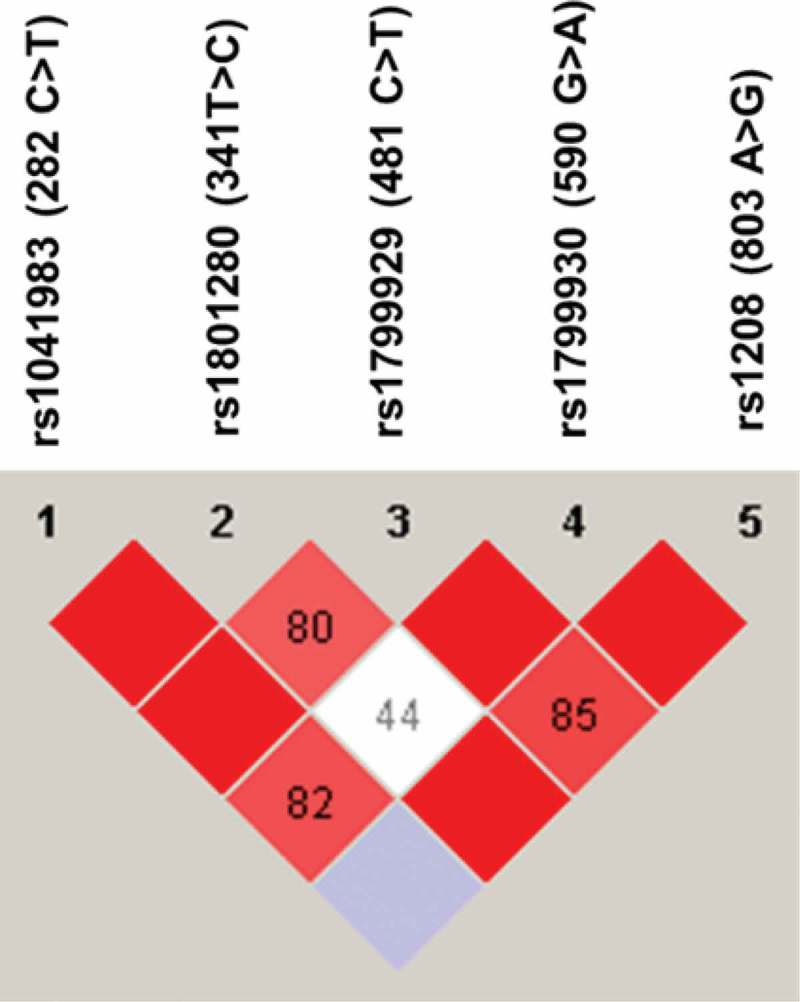
Figure 2.

Linkage disequilibrium (LD) of NAT2 genetic variants found among Jordanian volunteers. The LD was carried out using Haploview software. The red squares represent a strong LD, and the white square represents a weak LD. The blue square indicates that there is no LD. Only genetic variants with a frequency higher than 5% were used for identification of LD.
