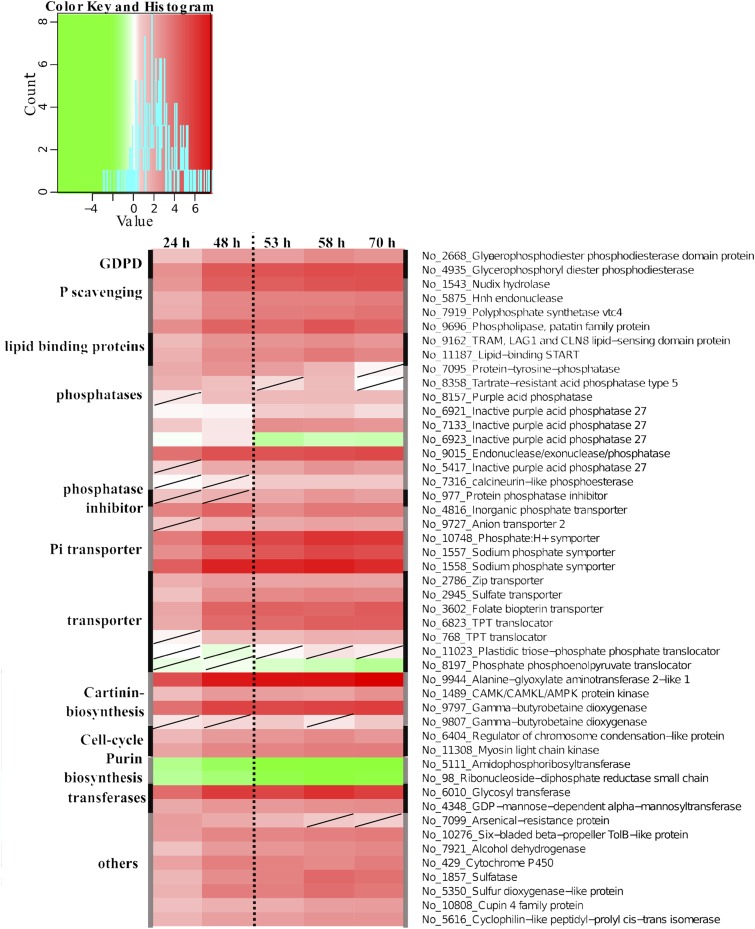
Figure 2.
Transcriptional regulation of early responses and transporters under P limitation in N. oceanica. Regulation patterns (colored squares ranging from green to red) are derived from microarray data of putative genes encoding enzymes (black) that are involved in immediate responses to P limitation. All time points of the experiment are shown (24, 48, 53, 58, and 70 h). The scale at top represents gene expression ratio values, log2 transformed with P > 0.01 (nonsignificant regulation [diagonal line in a square]). No_ numbers indicate NannoCCMP1779 gene identifiers.

