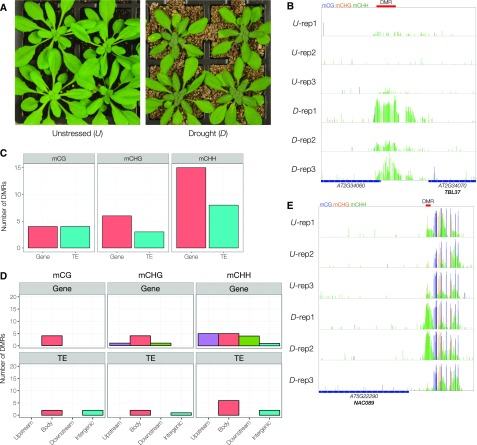
Figure 1.
A mild drought stress is associated with variations in DNA methylation. A, Representative plants that were either unstressed (U) or underwent a drought stress (D) involving 9 d of withheld watering. B, Representative drought stress-associated DMR identified by DSS. Rows represent individual samples. DNA methylation is shown at single C resolution for mCG, mCHG, and mCHH as blue, orange, and green bars, respectively. Underlying genomic elements are presented at the bottom, and the exact region identified as a DMR is shown on top (red bar). C, Numbers of filtered stress-associated DMRs occurring near annotated protein-coding genes and TEs for each methylation context. D, Detailed mapping of filtered stress-associated DMRs within, or near, annotated protein-coding genes and TEs for each context of methylation. Body refers to DMRs occurring within the genomic feature, Upstream refers to DMRs within 1 kb near the 5′ end of the feature, Downstream refers to DMRs within 1 kb of the 3′ end of the feature, and Intergenic refers to DMRs that are farther than 1 kb away from the nearest genomic feature. E, Drought stress-associated DMR identified upstream of a gene encoding NAC089, identified previously as a locus exhibiting transcriptional memory to repeated dehydration stress. Rows represent individual samples. DNA methylation levels are shown at single C resolution for mCG, mCHG, and mCHH as blue, orange, and green bars, respectively. Underlying genomic elements are presented at the bottom, and the region identified as a DMR is shown on top (red bar).

