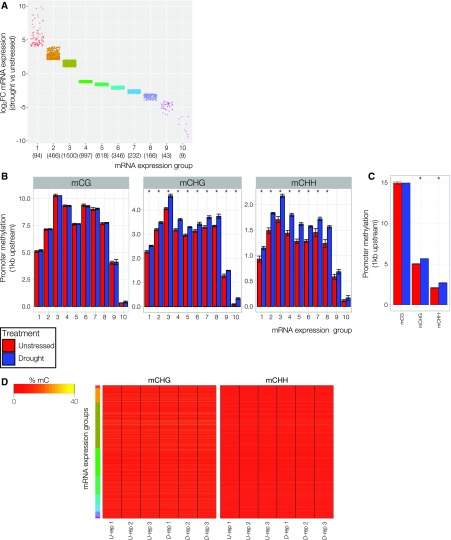
Figure 2.
Promoter methylation levels at drought-responsive genes. A, Strip chart depicting log2 fold change in mRNA expression of all drought-responsive genes grouped based on k-means clustering. Dots represent individual drought-responsive loci. Numbers of genes in each cluster are presented in parentheses. B, Summarized methylation levels in the 1-kb region directly upstream of drought-responsive loci averaged across all genes in each expression group as defined in A. Bars denote mean, error bars denote standard error of the mean (n = 3), and asterisk denotes significant differences (P < 0.05) between treatments as determined by a Kruskal-Wallis rank sum test. C, Summarized methylation levels in the 1-kb region directly upstream of 437 randomly selected non-drought-responsive loci. Bars denote mean, error bars denote standard error of the mean (n = 3), and asterisk denotes significant differences (P < 0.05) between treatments as determined by a Kruskal-Wallis rank sum test. D, Heat maps of mCHG and mCHH levels summarized 1 kb directly upstream of drought-responsive loci for individual transcripts ordered by expression group (as defined in A) and subsequently by log2 fold change (top = highest; bottom = lowest).

