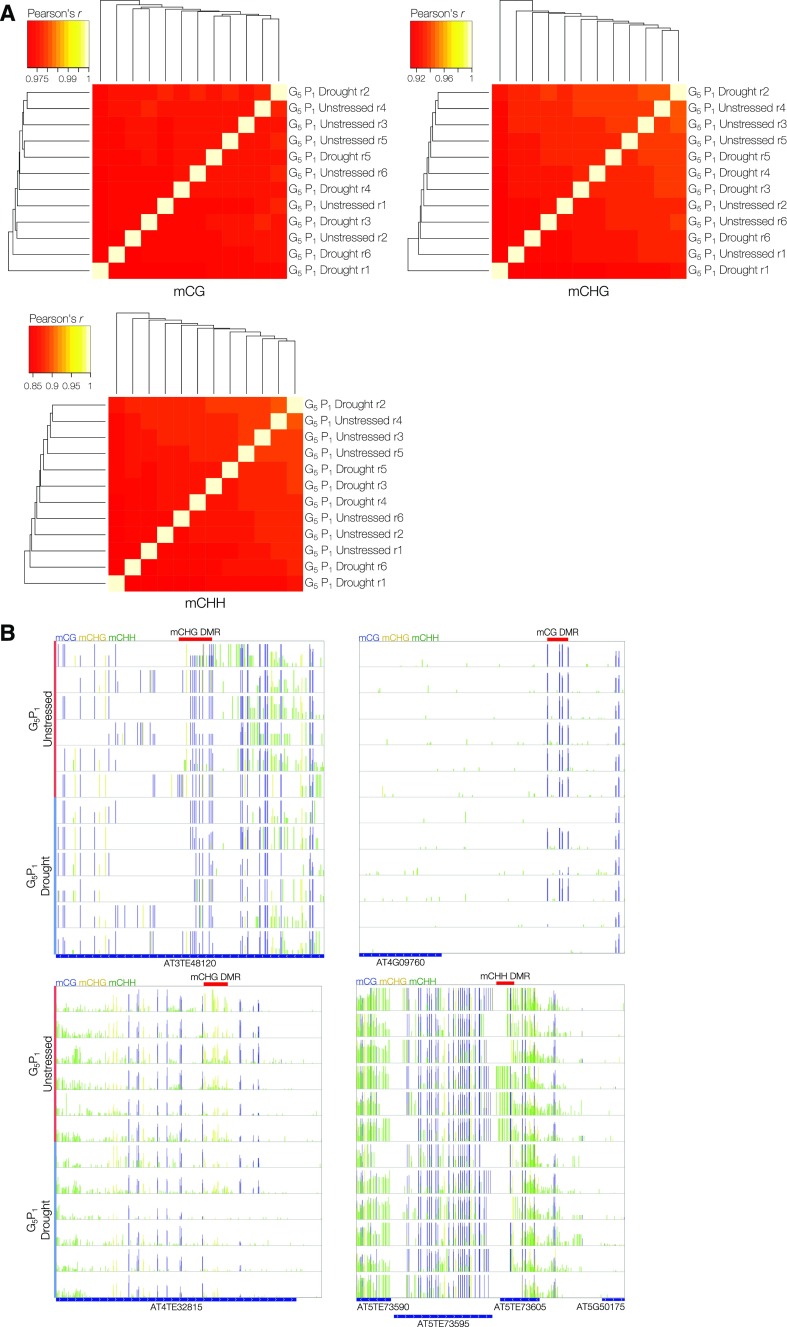
Figure 5.
Limited methylome variation associated with transgenerational drought stress. A, Heat maps representing two-dimensional hierarchical clustering of correlations (Pearson’s r) in genome-wide DNA methylation levels, in all sequence contexts, averaged across 100-bp bins confirms similar broad DNA methylome patterns between all G5 descendants. B, Integrative Genomics Viewer (IGV) visualization of lineage-associated DMRs identified by DSS (red bars). Vertical blue, yellow, and green bars denote mean mCG, mCHG, and mCHH, respectively, at single C resolution.

