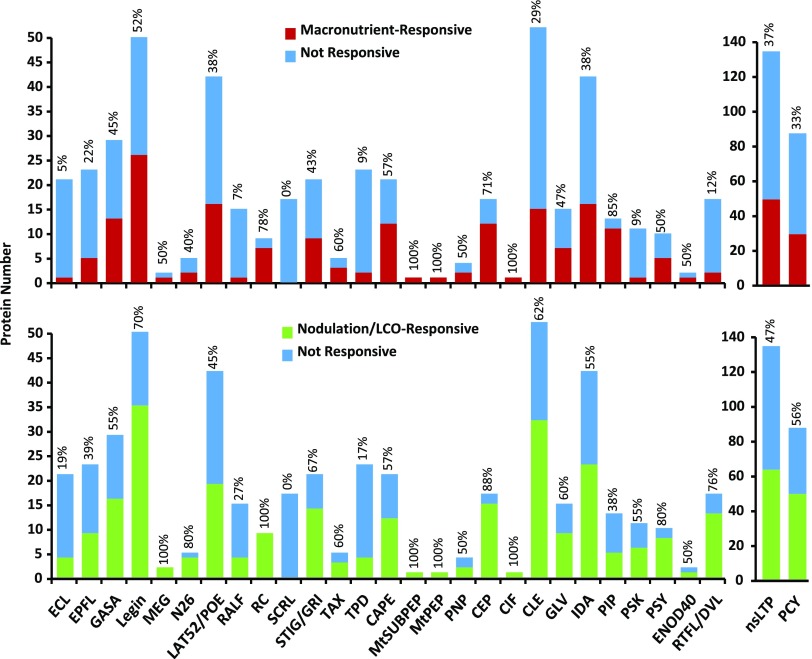
Figure 5.
Most Signaling-SSP families contain macronutrient- and nodulation-responsive genes. The numbers of genes from each family that are responsive (adjusted P < 0.1 and 2-fold or greater change) to at least one macronutrient deficiency (top) or one nodulation/LCO time point (bottom) are plotted for each Signaling-SSP family. The fraction of each family that is responsive is indicated above each column, as a percentage.

