Figure 4.
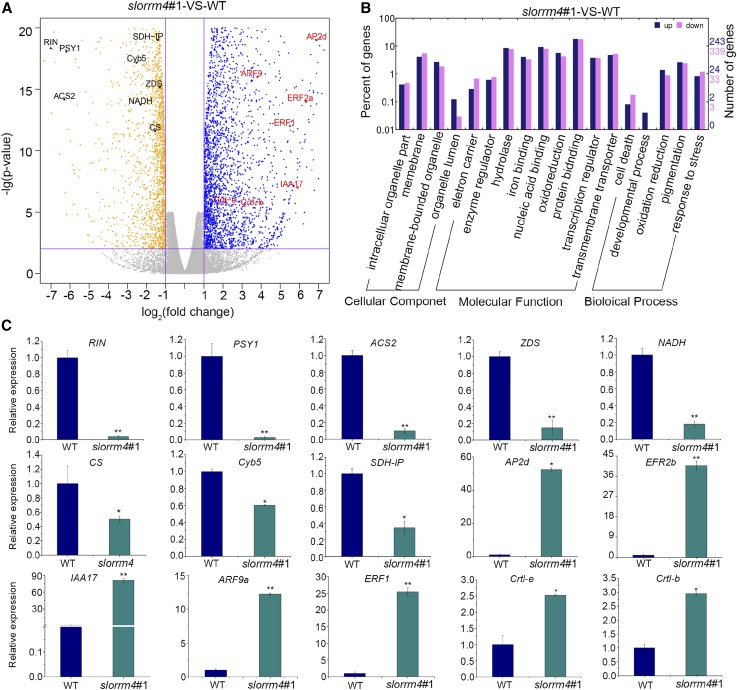
SlORRM4 regulates the expression of fruit ripening and mitochondria function-related genes. A, Volcano plots were used to visualize RNA-seq data. Each point corresponds to a DEG. Blue plots represent up-regulated genes, and orange plots represent down-regulated genes, in slorrm4#1 compared with the wild type. Eight representatively up-regulated genes are marked in black text, and seven significantly down-regulated genes are labeled in red text. Fold change > 2 and P < 0.01 (indicating DEGs) are marked with purple lines. B, Functional categories of genes that differed in abundance between slorrm4#1 and the wild type (WT; both at 32 DPA). Dark blue and purple represent up- and down-regulated genes, respectively. C, qRT-PCR validation of RNA-seq results showing the relative expression of 15 significant DEGs. Values are means ± sd of three independent experiments in three biological repeats. Asterisks indicate P < 0.05 (*) and P < 0.01 (**; Student’s t test).

