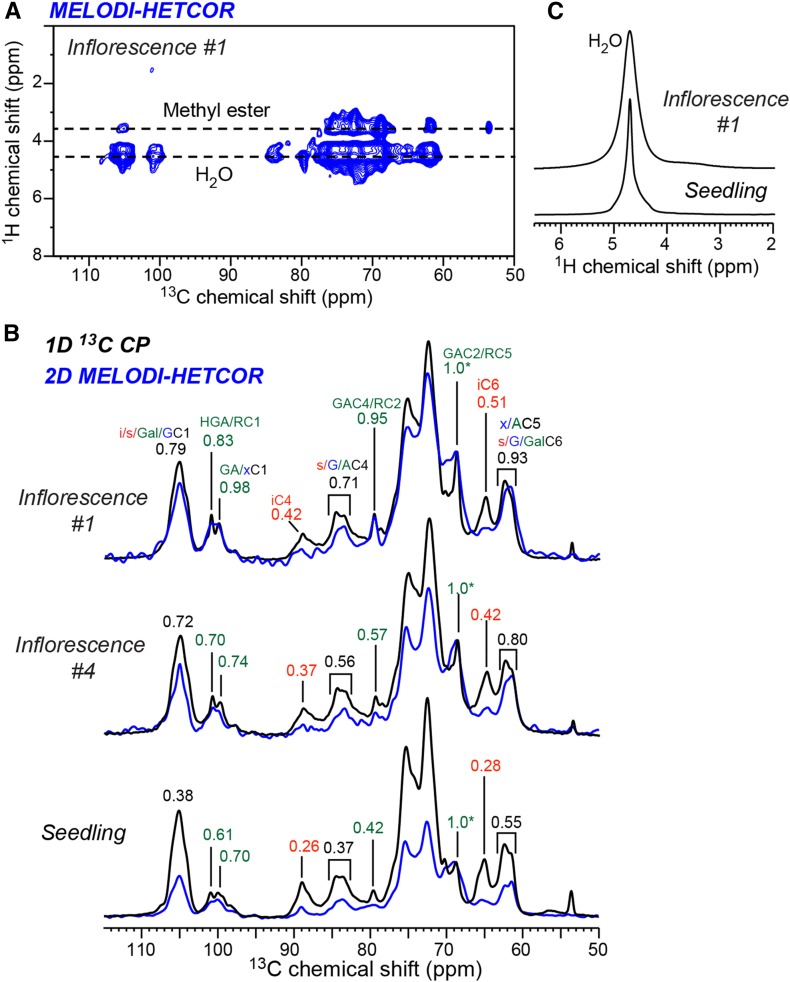
Figure 6.
2D 1H-13C correlation spectra to investigate polysaccharide hydration. A, 2D MELODI-HETCOR spectrum of inflorescence #1 measured using a 1-ms 1H spin diffusion and Lee-Goldburg CP polarization transfer, which suppresses highly dynamic signals, such as the 108-ppm Ara C1 peak and the 54-ppm methyl ester signal. B, Comparison of the water cross sections of the MELODI-HETCOR spectra (blue) and the 1D 13C CP spectra (black) of inflorescence #1, inflorescence #4, and seedling cell walls. Intensity ratios are indicated for selected peaks. C, 1D 1H spectra of inflorescence #1 and seedling cell walls, showing a broader water peak and, hence, more immobilized water in the inflorescence cell wall.

