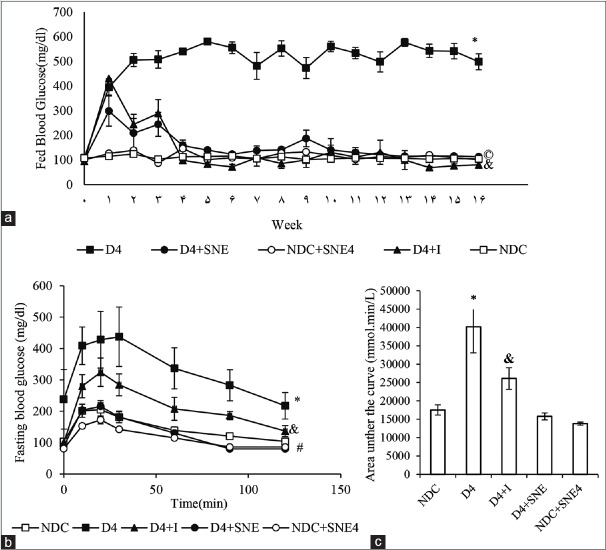
Figure 1.
Comparison of weekly-fed blood glucose (a) and intraperitoneal glucose tolerance Test (IPGTT) (b and c). #P < 0.01 Significant difference between NDC group and the other groups. *P < 0.01 Significant difference between D4 group and the other groups, & P < 0.05 D4+I vs. the other groups, ©P < 0.05D4+SNE vs. the other groups.

