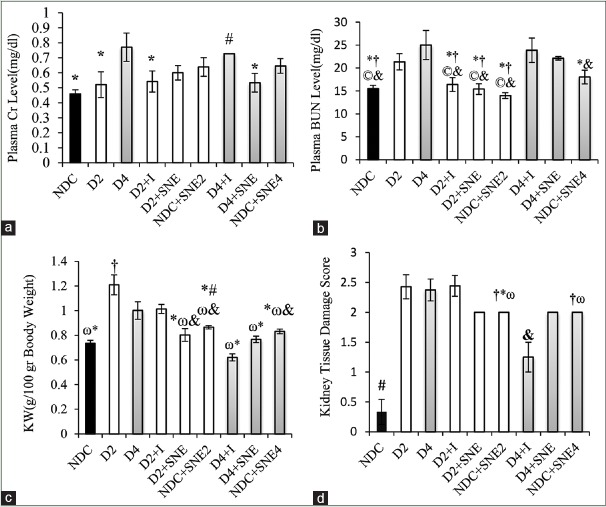
Figure 2.
(a) Plasma levels of Cr and (b) BUN, (c) kidney tissue damage score, (d) KW (kidney weight). *P < 0.05 D4 group vs. other groups, #P < 0.05 NDC group vs. the other groups, & P < 0.05 D4+I vs. the other groups, †P<0.05 D2 group vs. the other groups, ©P < 0.05 D4+SNE vs. the other groups, ωP < 0.05 D2+I vs. the other groups.

