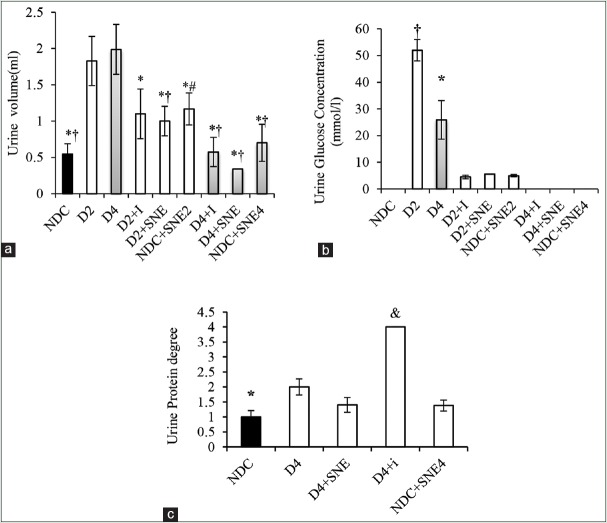
Figure 5.
Urine volume (a), urine glucose concentration (b) and urine protein degree (c) in NDC Group (non- diabetic control rats), D2 (Diabetic rats for 8 weeks), D2+I Group (Insulin - treated diabetic rats for 8 weeks), NDC+SNE2 (S. nigrum extract – treated non-diabetic rats for 8 weeks, D2+SNE (S. nigrum extract–treated diabetic rats for 8 weeks), D4 (diabetic rats for 16 weeks), D4+SNE (S. nigrum extract–treated diabetic rats for 16 weeks), NDC+SNE4 (S. nigrum extract–treated non-diabetic rats for 16 weeks), and D4+I (Insulin treated diabetic rats for 16 weeks). *P < 0.05 D4 group vs. other groups, #P < 0.05 NDC group vs. other groups, & P < 0.05 D4+I vs. other groups, †P < 0.05 D2 vs. other groups.

