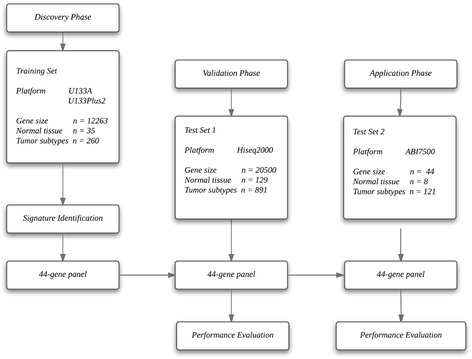
Fig. 1.

Flow diagram of gene expression signature identification and performance assessment. Gene expression profiles were retrieved from the U133A/ U133APlus2 microarray through a bioinformatics approach. Gene expression analyses were performed in the training set (six GEO microarray datasets) first and then validated in TCGA cohort two validation sets (and the FUSCC cohort)
