
Fig. 3.
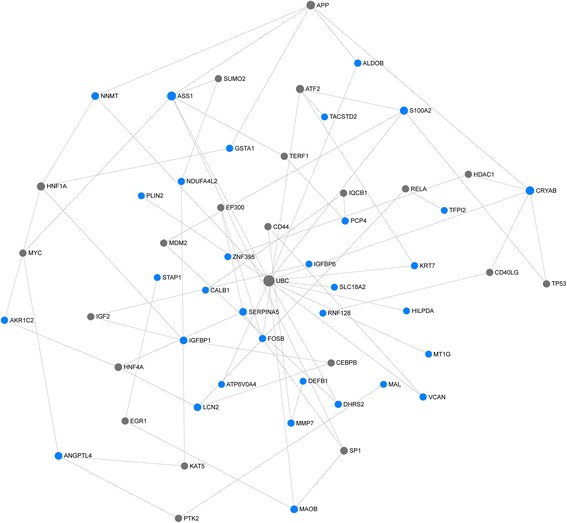
Protein-protein interaction network of the 44-gene set. The network of protein-protein interactions of the 44-gene set inferred using the IMEx Interactome Database. Blue nodes indicate the proteins present in the 44-gene set, whereas grey nodes represent proteins not in the 44-gene set. The size of the node is proportional to the degree of connections. The large nodes represent a few high-degree hub nodes, while most small nodes have only a few connections