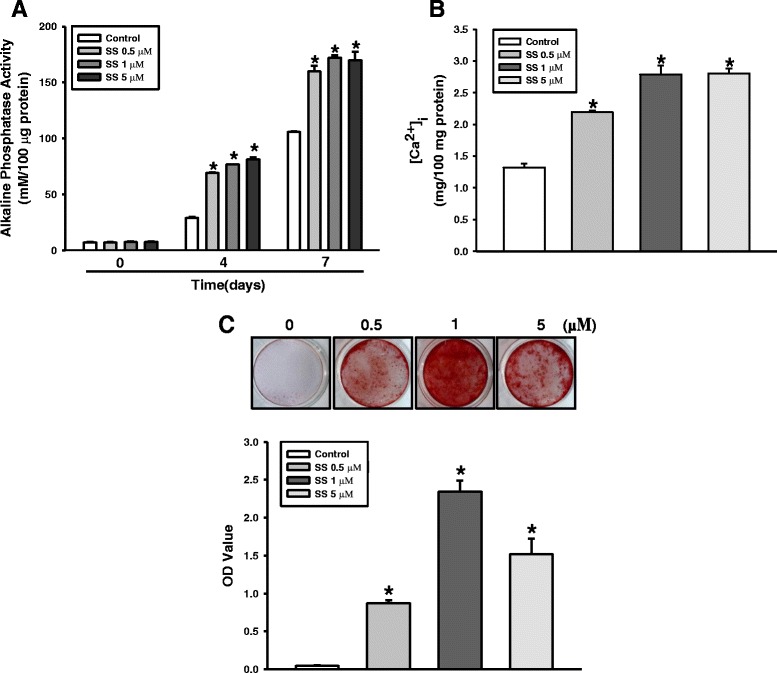
Fig. 2.

Effect of oxysterols on PDLSC osteogenesis. Cells treated with different oxysterol concentrations (SS; 0.5, 1, and 5 μM) for 0, 4, 7, or 14 days. a ALP activity, b [Ca2+]i, and c Alizarin red staining. Lower panels (bars) denote Alizarin Red quantification. Values reported as means ± SD of five independent experiments. *P < 0.05 vs control value at each time point. [Ca2+]i intracellular calcium level, SS 22(S)-hydroxycholesterol and 20(S)-hydroxycholesterol
