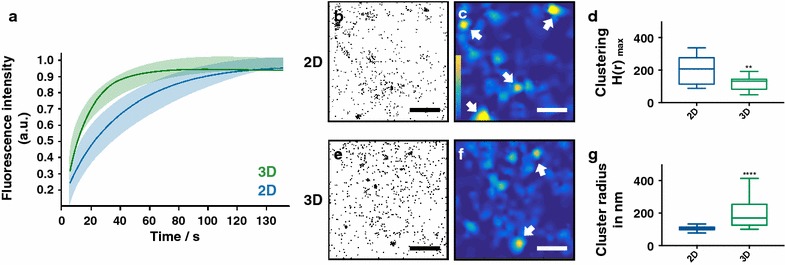
Fig. 1.

2D vs. 3D cell culture conditions have a strong impact on the membrane mobility and cholesterol raft organization. a FRAP curves of PM located CAAX-mCherry of 2D (blue, n = 8) and 3D (green, n = 9) cultured OV-MZ-6 cells. Exponential fits of recovery dynamics and the standard derivations. b–g Single molecule data of cholesterol stainings of 2D and 3D MEF cells as well as corresponding cluster analysis. b, e Scatter plots show all detected cholesterol molecules, c, f corresponding heat maps visualize clustered (yellow) and unclustered (dark blue) regions, arrows indicate cholesterol rafts. Scale bar is 1 μm. Statistical analysis with the Ripley’s K function reveals the clustering (d) and the cluster size (g). Statistical analysis was performed with a Mann–Whitney test. **p ≤ 0.01 and ****p ≤ 0.0001
