Fig. 2.

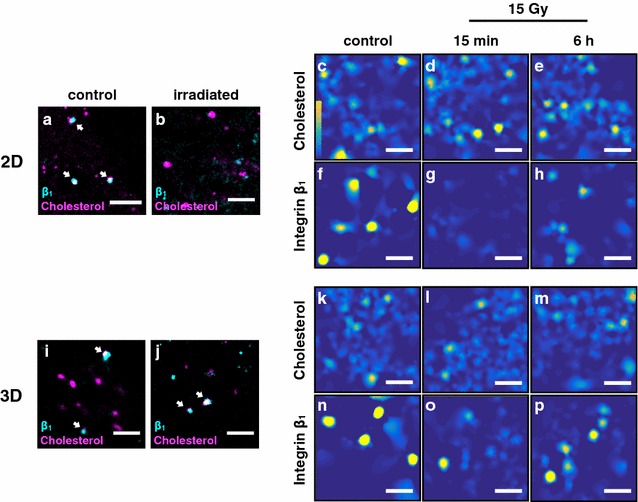
Effects of high dose irradiation on the integrin β1-cholesterol raft colocalization of 2D and 3D cultured MEF cells. a, b, i, j Superresolution images of PM located integrin β1 (cyan) and cholesterol (magenta) colocalizations of a 2D control cell (a), a 2D cell irradiated with 15 Gy (X-ray) (b), a 3D control cell (i) and a 3D cell irradiated with 15 Gy (j). Cells were fixed 15 min after irradiation. Scale bar is 2 µm. Arrows indicate regions with integrin β1-cholesterol colocalization (white). c–h Heat maps visualize clustered (yellow) and unclustered (dark blue) regions of 2D cells stained for cholesterol (c–e) and integrin β1 (f–h). Shown are heat maps of controls (c, f), cells irradiated with 15 Gy and fixed after 15 min (d, g) and after 6 h (e–h). Scale bar is 1 µm. k–p Corresponding data for 3D cultured cells
