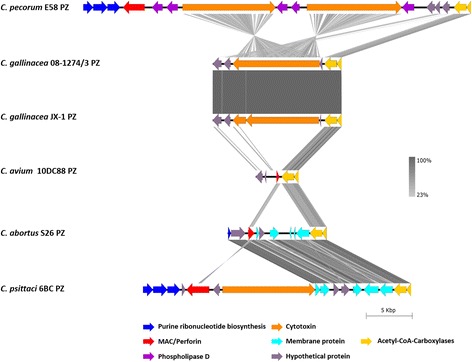
Fig. 4.

Graphical representation of the gene content in chlamydial PZs, including the two C. gallinacea strains analyzed in this study. Colored arrows in the legend denote PZ genes according to their function, while the grey shading scale denotes % sequence similarity. Image was generated with Easyfig using tblastx comparison
