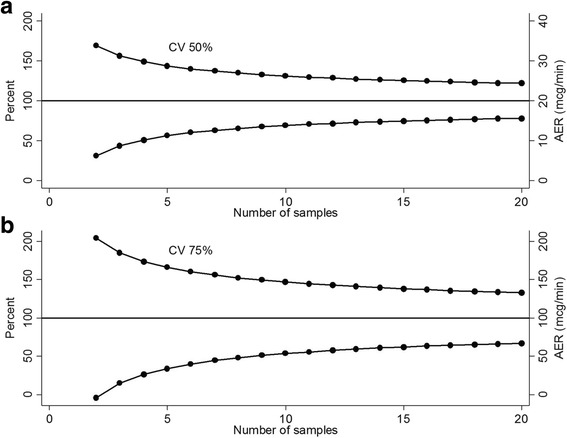
Fig. 2.

Panel a: (top) Theoretical plot for intra-individual coefficient of variation in the normoalbuminuria group with 95% confidence intervals for 2–20 samples: coefficient of variation = 50%, mean AER = 20 mcg/min. Panel b: (bottom) Theoretical plot for intra-individual coefficient of variation in the microalbuminuria group with 95% confidence intervals for 2–20 samples: coefficient of variation = 75%, mean AER = 100 mcg/min
