
Fig. 5.
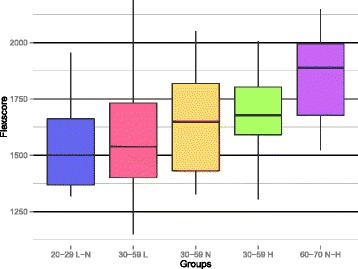
FlexScore distribution per study group. Box shows the interquartile range (IQR) with the median. The line indicates the range of observations within the ± 1.5 × IQR. Groups labeling used the respective age intervals as well as their body fat percentage intervals, L for low, N for normal, and H for high