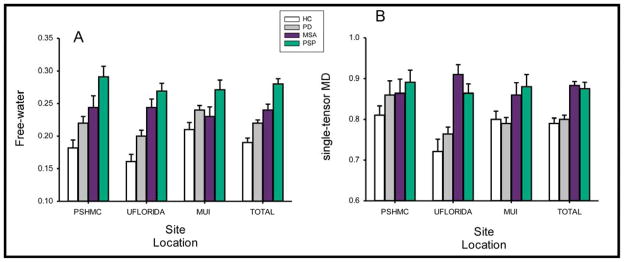
Figure 1.
Free-water and single-tensor mean diffusivity across sites. The bar graphs indicate the levels of free-water and single-tensor mean diffusivity for healthy controls, Parkinson’s disease (PD), multiple systems atrophy (MSA), and progressive supranuclear palsy (PSP) subjects across all sites and within each site.

