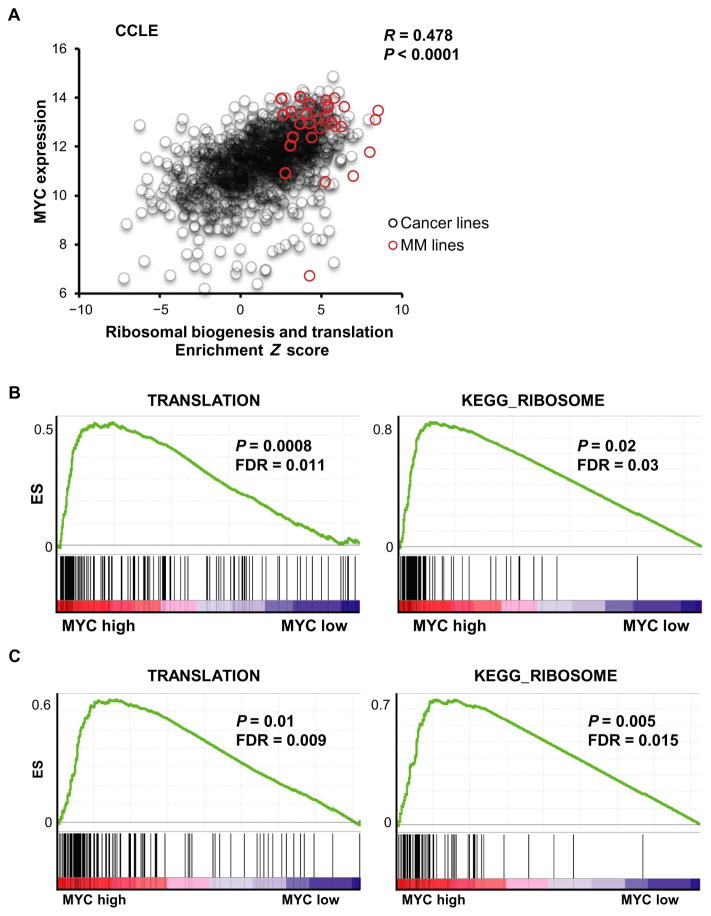
Fig. 1. Correlation of MYC expression with ribosomal biogenesis and translation activity.
(A) Correlation analysis of MYC expression on the y axis and the Z-score enrichment across over 1000 cell lines from the CCLE database. A Z score was generated for each cell line by combining two KEGG canonical pathway gene sets: ribosomal biogenesis and translation. Red dots indicate MM cell lines, and black circles indicate all CCLE cell lines except MM. A significant correlation between MYC expression and the translation activation was observed; R = 0.478, P < 0.0001. Gene Set Enrichment Analysis (GSEA) of MM patient tumor cell-derived gene expression profiling (GSE6477 and GSE16558) shown in (B) and (C), confirming enrichment of translation and ribosomal biogenesis in context of high expression of MYC. ES, enrichment score; FDR, false discovery rate.

