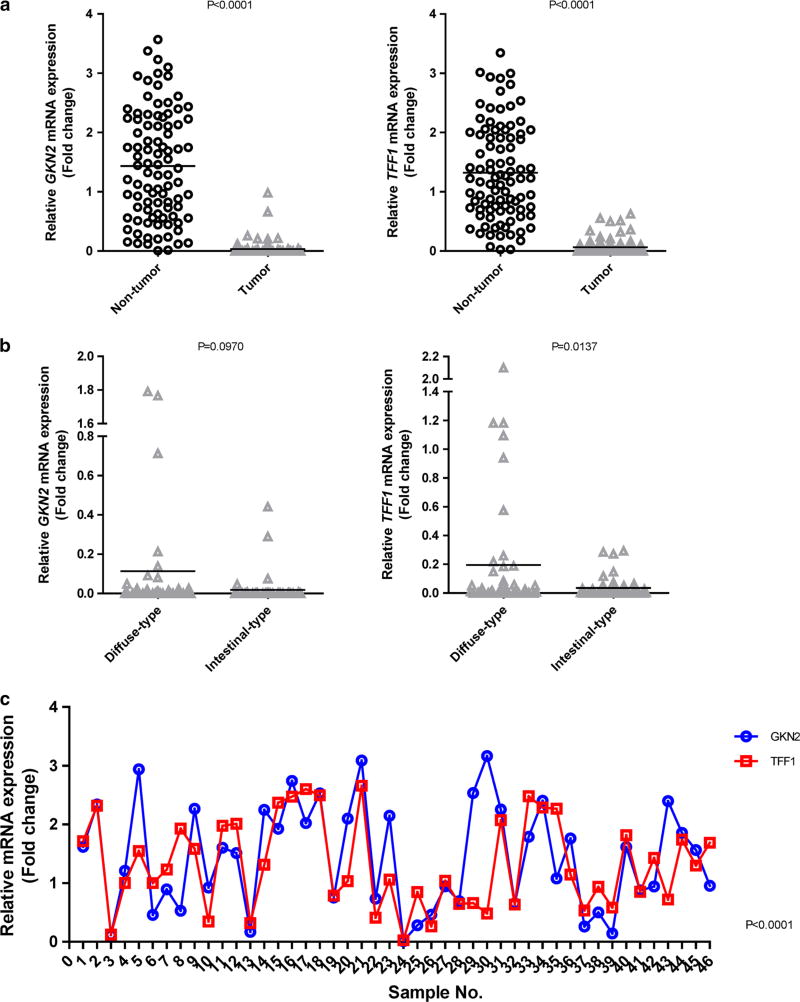
Fig. 4.
a–c Positive correlation between GKN2 and TFF1 mRNA transcript expression. a In real-time RT-PCR analysis, the mRNA expression levels of GKN2 and TFF1 were greatly decreased in tumor tissues compared to those in corresponding non-tumor samples. b The TFF1 mRNA expression level was significantly lower in intestinal-type gastric cancers. c There was a positive correlation between GKN2 and TFF1 mRNA expression in non-tumor samples. GKN2 and TFF1 mRNA levels were normalized to the mRNA level of the housekeeping gene GAPDH. The standard curve method was used to quantify the relative amounts of gene expression products. This method provides unitless normalized expression values that can be used for direct comparison of the relative amounts of mRNA in different samples. All samples were tested in triplicate. Data are reported as relative quantities according to an internal calibrator using the 2−ΔΔCT method

