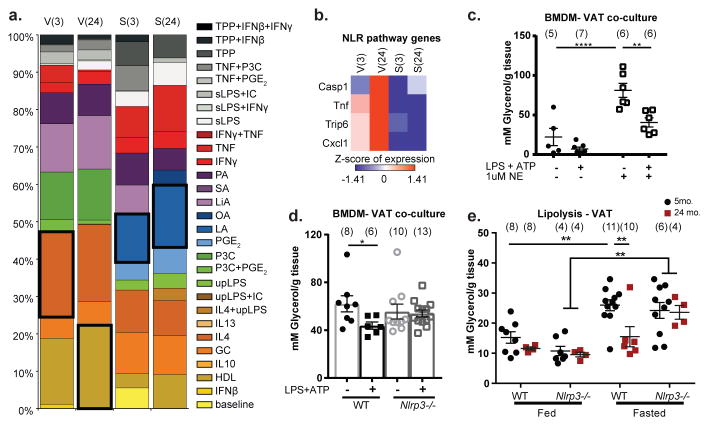
Figure 2. Nlrp3 inflammasome activation is required for lipolysis resistance.
a, Relative fractions of 29 different human in vitro-activated macrophage gene signatures in the 3- and 24-month macrophages from VAT and spleen. Black box indicates the largest enrichment signature for that condition. b, Heatmaps of differentially expressed genes associated with NOD-like receptor signaling pathway in 3- and 24-month ATMs (V(3), V(24)) and splenic macrophages (S(3), S(24)). Expression values were z-transformed and scaled as indicated. c, Glycerol release from 3-month VAT explants co-cultured with NLRP3-activated BMDMs (Exact Ns (biological replicates) are listed in the figure; Student’s T-Test; P value *<0.05). d, Glycerol release from 3-month VAT explants co-cultured with WT (filled) or Nlrp3−/− (open) BMDMs that were left untreated (circles) or treated (squares) with LPS and ATP to activate the inflammasome (Exact Ns (biological replicates) are listed in the figure; Tukey’s Test; P value **<0.01, ****<0.0001). All conditions received 1uM NE to stimulate lipolysis. e, Glycerol release from VAT of WT or Nlrp3−/− mice at 5- or 24-months after 24hour feeding or fasting. (Exact Ns (biological replicates) are listed in the figure; Tukey’s Test; P value **<0.01). Graphs are presented as mean±SEM. Exact Ns are listed within the figure (c,d,e), and listed in table 1 for pooled values (a,b).

