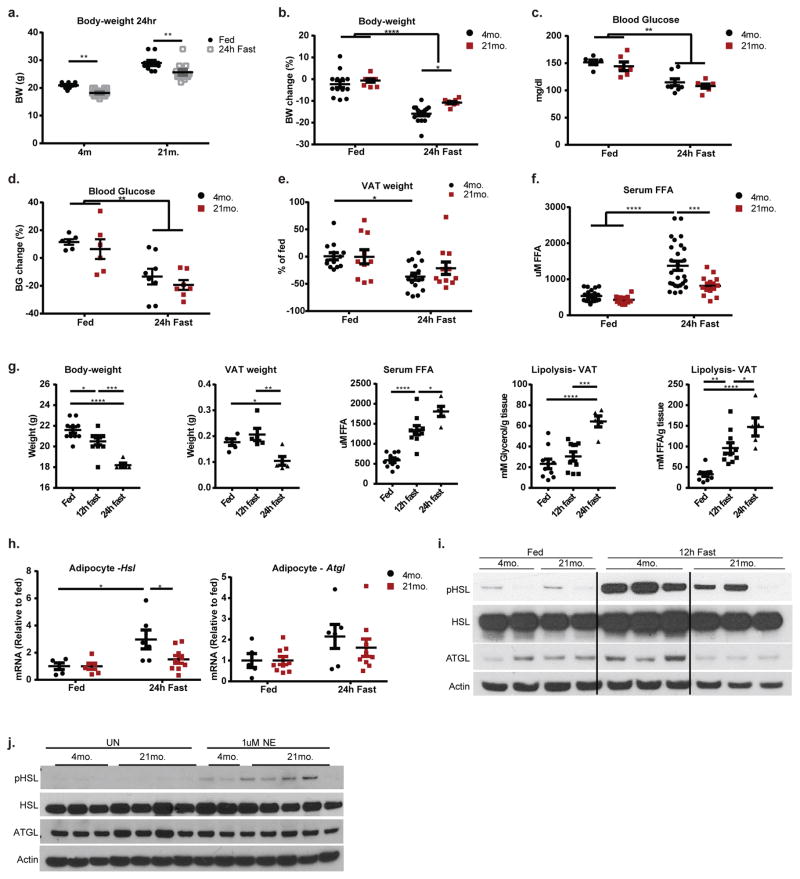
Extended data Figure 1. Age-related AT defects in response to fasting, related to Figure 1.
a, Body-weight after 24h feeding or fasting. Each symbol represents an individual mouse. Data are represented as mean±SEM. N= (13) 4-month fed; (10) 21-month fed; (16) 21-month fast; (11) 21-month fast pooled from 2 independent experiments. b, Percent body-weight change after 24 hour fasting. Each symbol represents an individual mouse. Data are represented as mean±SEM. N= (13) 4-month fed; (10) 21-month fed; (16) 21-month fast; (11) 21-month fast pooled from 2 independent experiments. c, Blood glucose, each symbol represents an individual mouse. Data are represented as mean±SEM. N= (6) 4-month fed; (6) 21-month fed; (8) 21-month fast; (7) 21-month fast. d, Percentage change in blood glucose after feeding or fasting. Each symbol represents an individual mouse. Data are are represented as mean±SEM. N= (6) 4-month fed; (6) 21-month fed; (8) 21-month fast; (7) 21-month fast. e, VAT weight, displayed as a percentage of fed. Each symbol represents an individual mouse. Data are represented as mean±SEM. N= (13) 4-month fed; (10) 21-month fed; (16) 21-month fast; (11) 21-month fast pooled from 2 independent experiments. f, Serum FFA in fed and fasted mice. Each symbol represents an individual mouse. Data are pooled from 4 independent experiment and are represented as mean±SEM. n= (23) 4-month fed; (13) 21-month fed; (26) 4-month fasted; (13) 21-month fasted; each symbol represents an individual mouse. g, Body-weight, VAT weight, serum FFA, glycerol and FFA release from VAT explants in 4-month old fed, 12h fast or 24h fasted animals. Data are pooled from 2 independent experiments and are represented as mean±SEM. n= (10) fed, (10) 12h fast and (5) 24h fast; each symbol represents an individual mouse. h, Hsl and Atgl gene expression in floating adipocytes isolated from VAT of 4- (black) or 21-month old (red) mice that were fed or fasted for 24h. Data are represented as mean±SEM. N= (5) 4-month fed; (6) 21-month fed; (6) 4-month fast; (9) 21-month fast pooled from 2 independent experiments. i, Western blot of lipolytic signaling pathway (pHSL, HSL, ATGL) in VAT from 4- or 21-month old mice fed or fasted for 12h. Each lane is an individual animal that received indicated treatment. Actin was probed for as a loading control. Representative of one experiment. j, Western blot of lipolytic signaling pathway (pHSL, HSL, ATGL) in VAT explants from 4- or 21-month old fed mice that were left unstimulated or stimulated with 1uM NE. Each lane represents a biological replicate. Representative of two individual experiments. Actin was probed for as a loading control. In all graphs (a–h), Tukey’s Test was used to identify statistical differences; P value *<0.05, **<0.01, ***<0.001, ****<0.0001

