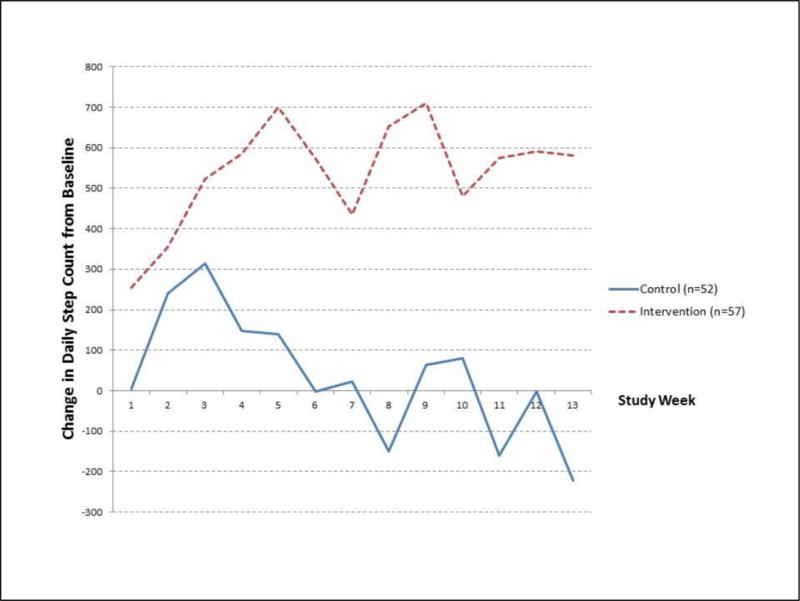
Figure 2. Change from baseline daily step count by randomization group.

Control group = Pedometer alone, Intervention group = Pedometer plus website
Values plotted on the y-axis are from least square means solutions for change in daily step count from a generalized linear mixed-effects model for repeated measures, adjusting for FEV1 % predicted and season of intervention week. At week 13, subjects in the pedometer + website group walked an average change in step count from baseline of 804 steps more than subjects in the pedometer-only group (p = 0.02).
