Figure 2.

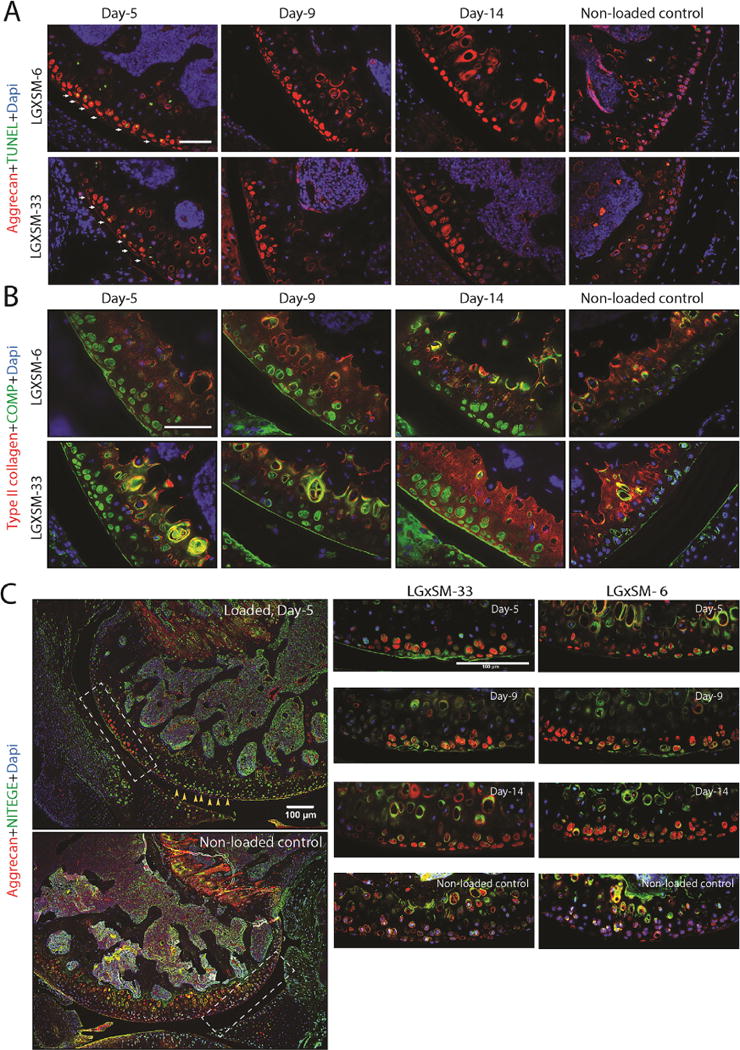
Chondrocyte apoptosis and distribution pattern of extracellular matrix proteins. (A) TUNEL assay identified apoptotic chondrocytes (green staining, white arrows) in the injured cartilage area in both strains at day 5 but not at day 9 or 14. Aggrecan (red staining) was found around the chondrocytes in the intact area and in the lacuna left by the apoptotic chondrocytes in the injured area (Bar=50 μm). (B) COMP (green staining) had the same distribution pattern as aggrecan in the injured region but could be seen less than aggrecan along the adjacent healthy cartilage surface. Type-II collagen (red staining) was uniformly found along the whole cartilage surface (Bar=50 μm). (C) The left panel shows typical images of the loaded and non-loaded control knees. NITEGE (green staining) was mainly found in the calcified layer of cartilage (hypertrophic chondrocytes) in non-loaded knees. However immunoreactivity of NITEGE was stronger in non-injured cartilage area of injured knees at all time points after injury (yellow arrows). In the injured cartilage, NITEGE was mainly in the extracellular matrix not in the dead chondrocytes (indicated by aggregated aggrecan staining without DAPI staining). Aggrecan staining (red) was undertaken to identify injury site. The area indicated by white dotted line boxes is shown at higher magnification. Bar=100 μm.
