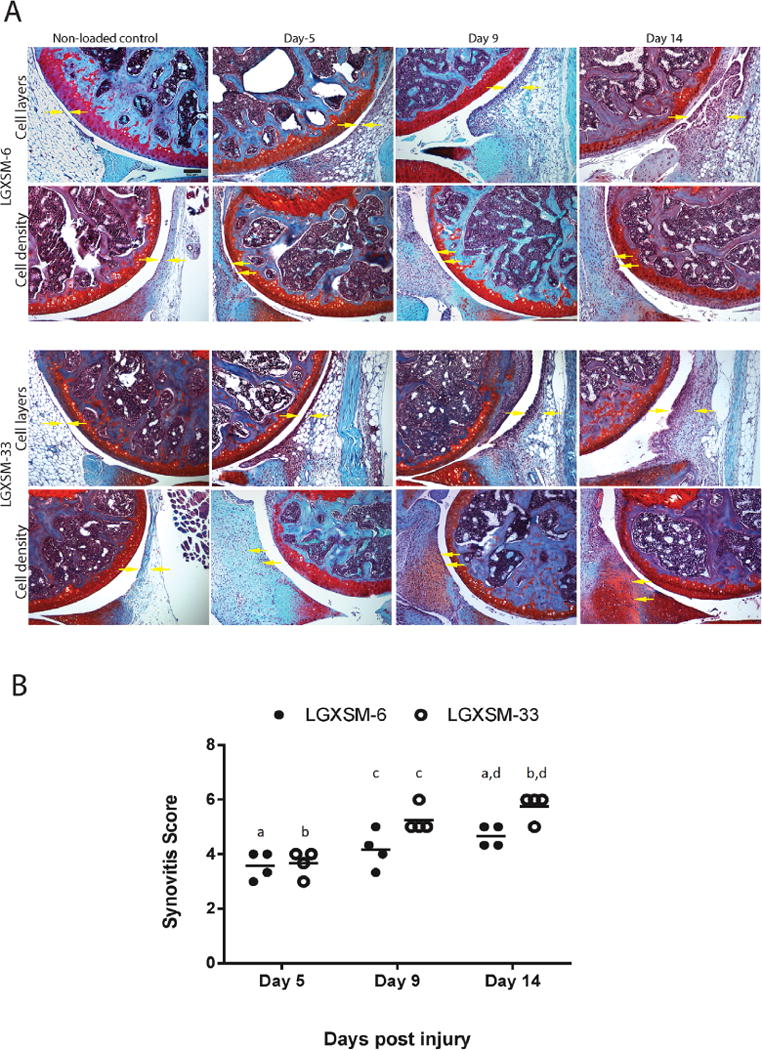
Figure 5.

Synovitis assessment. (A) Enlargement of the synovial lining cell layer and density of the cells in the synovial stroma (yellow arrows) were individually assessed. Bar=100 μm. (B) Quantification of synovitis score at day 5, 9, and 14 post-injury indicated a trend of increased synovitis overtime following injury. There was significantly higher synovitis in LGXSM-33 compared to LGXSM-6 at day 9 and 14 post-injury. Graphs represent mean ± SEM. p-value was set at <0.05. Identical lowercase letters represent statistical difference across groups (n=4 each time point and each strain).
