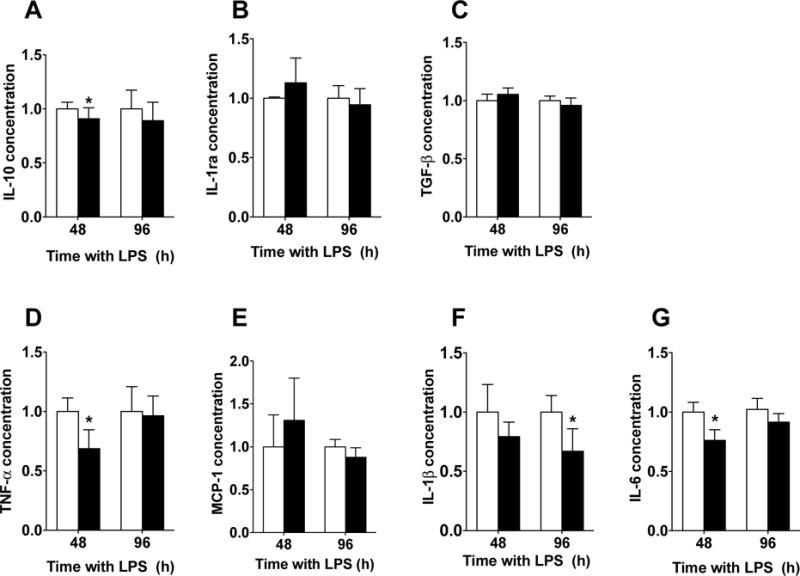
Figure 11. Changes of cytokine expression in CD163-overexpressing primary human macrophages challenged with a single LPS stimulation.

Quantification for IL-10 (A), IL-1ra (B), TGF-β (C), TNF-α (D), MCP-1 (E), IL-1β (F) and IL-6 (G) protein concentration in primary human macrophages with a single LPS stimulation and transfected with either a plasmid encoding for CD163 gene (pCD163) or the empty vector (pEmpty) at 48 and 96 hours after transfection. The concentration of each molecule was normalized to the control group (pEmpty), which was assigned a value equal to 1. N= 5–8 per group. *p<0.05 vs. pEmpty by student’s t-test.
